Skip to content

Report Wizard Guide

Nama ERP provides an easy and effective way to create professional reports quickly using the Report Wizard tool.

This tool lets you build reports by selecting the main table, then choosing the required fields and adding filters in a simple, fast manner — as will be explained in detail through the examples below.

Where to find it

Administration → Reports → Report Wizard.

The Report Wizard shares most of its screen with the Printing Form Wizard. Data sources, the field list, page setup, styles and conditional formatting work identically in both — Report and Form Wizards covers that shared half, and what follows here is what belongs to reports.

Creating a Simple Report to Display Sales Invoices

To create a report that shows sales invoice data such as invoice code, customer name, invoice date, and net invoice value, follow these steps:

  1. Create a new report using the Report Wizard and assign it an appropriate code and name.
  2. In the Main Table field, select SalesInvoice from the search screen.
  3. In the Fields table, add the following rows:
  • this to display the document code with a link to open the invoice details.
  • customer to display the customer name with a link to open the customer details.
  • money.netValue to display the net invoice value.
  1. In the Parameters table, add a single row containing the valueDate field to define the time period.

TIP

  • You can use the Select Fields button to display a visual field selection interface without having to type field names manually.
  • When you type part of a field name (in Arabic or English), you can press the down arrow to see suggested fields.
JSON for direct import
json
{
  "mainTable": "SalesInvoice",
  "fields": [
    { "fieldId": "this" },
    { "fieldId": "customer" },
    { "fieldId": "money.netValue" }
  ],
  "parameters": [
    {
      "fieldId": "valueDate",
      "filterType": "Between"
    }
  ]
}

After saving, click the Run button. A screen similar to the following will appear:
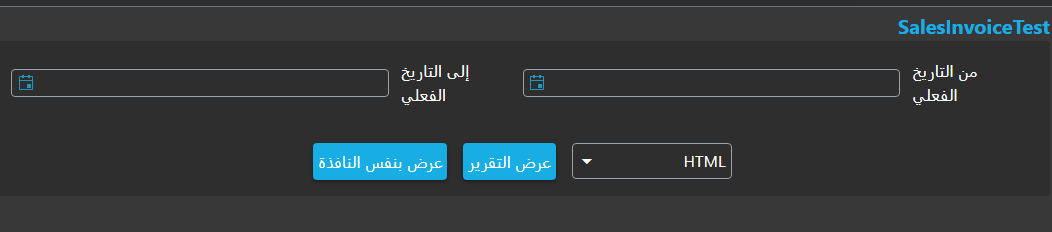
Run the report - select start and end date

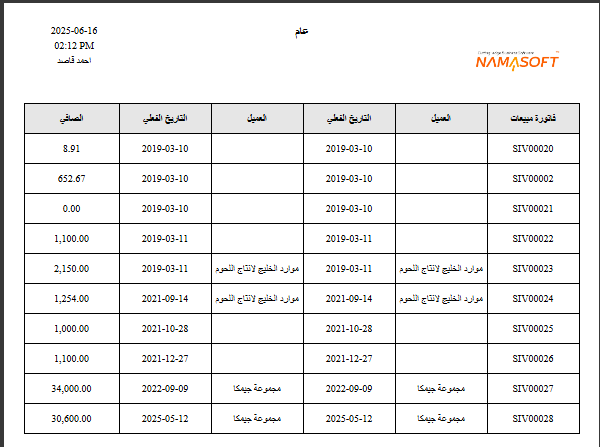
Select an appropriate time period (from date - to date) and click Run. The report will appear as follows:

Report result - sales invoices

As you can see, a report with time filters and professionally organized columns was generated, and the company logo, run date and time, and username are displayed automatically.

Detailed Explanation of Report Wizard Fields and Tables

In this section we provide a precise explanation of all fields used in the Report Wizard, clarifying the function of each field and how it affects the resulting report.

Report Group

When you save a Report Wizard file, a new report file is automatically created in the system. You can use this field to specify the group under which the report will be classified, which helps organize reports by department or function.


Table Type

This field helps you narrow down the selection of the Main Table for the report by categorizing the available tables. It contains the following values:

  • Entity Lets you choose any entity type available in the system, such as:

    • SalesInvoice (Sales Invoice)
    • PaymentVoucher
    • Customer
    • Supplier
    • Employee
    • Account and other main entities in the system.
  • Detail Line Lets you choose one of the detail line tables associated with entities, such as:

    • SalesInvoiceLine: sales invoice line details
    • CustomerContactInfo: contact information in the customer file
  • System Table Lets you choose internal system tables such as:

    • ItemDimensionsQty: displays item quantities across different warehouses
    • FAPropertiesEntry: displays fixed asset properties
  • Virtual Entity Lets you choose one of the virtual entities defined by the user via a custom SQL query (such as a UNION of two tables or joining several tables with calculated expressions). These entities appear in the main table list just like real entities, with the same field-selection mechanism, translations, and automatic entity reference fields (Reference Fields).

    To define a new virtual entity or understand how to set up column mappings and the Bootstrap mechanism, see the Virtual Entity Guide.


Report Title (Arabic) and Report Title (English)

These fields define the report title displayed at the top of the final report. The value shown depends on the user's language: if the interface is in Arabic the Arabic title is shown, and if it is in English the English title is shown.


Layout Method

This field determines how fields and parameters are laid out inside the resulting report. It contains the following options:

  • Manual Lets you manually specify properties for each field and parameter — such as position, width, and height — through the tables inside the Report Wizard file.

  • From Uploaded File Allows you to upload a pre-built Jasper file (.jrxml extension) and use the field properties and positions already defined in it inside the report.

  • From Editor Lets you use a visual editor to format fields and define their positions inside the report. The editor can be opened via the Open Editor button.


Parameters — the questions the report asks before it runs

A report covers a range of records, so the first thing it does is ask the reader which range they want. Every question on that run screen is one row in the Parameters grid, and the rows are asked in the order you list them.

There are three ways to describe a parameter, and the one you pick depends on where the value it narrows actually lives.

Point it at a field. Put a field path in On FieldvalueDate, customer, money.netValue. The wizard works out the data type on its own, builds the control that suits it (a date picker, a customer lookup, a number box) and adds the matching condition to the report's query. This is what you want almost every time.

Point it at a column you already listed. Leave On Field empty and type, in User Alias (In Case SQL Expression), the alias of a row from the Fields grid. The parameter then narrows that column — including a column you calculated yourself.

Give it its own expression. Fill Custom SQL Expression on the parameter row and it narrows that expression instead of a stored column. Use Param Type to tell the wizard what kind of value it is, because there is no field to infer it from.

Select Parameters Fields

The Select Parameters Fields button opens the same visual field picker the Fields grid uses, so you rarely have to type a path by hand.

Filter Type shapes the control, not just the condition

Filter Type says how the reader's answer is compared to the data — Equals, Not Equal, Greater Than, Less Than, Contains, In, Between and so on. Leave it empty and the wizard chooses one that suits the field's type. It also decides what the reader is handed:

  • In and Not In turn one box into a multi-select, and List Display Type then decides how that list of choices is presented.
  • Contains, Does Not Contain, Starts With and Ends With give a free-text box and match on part of the value.
  • The With Null variants — Equals With Null, Greater Than With Null and their siblings — keep records whose value is empty instead of dropping them, which matters on optional fields.
  • Has Value Or Not asks for no value at all. It offers a three-way choice: only records where the column has something, only records where it is empty, or all records — and it starts on all records, so the report is unfiltered until the reader says otherwise. Has Value For Total runs the same test against the column's total rather than each row.
  • Between does something different enough that it needs its own section.

Between asks two questions, not one

Set Filter Type to Between and the wizard does not create one parameter — it creates two, a from and a to. It builds their captions out of your Arabic Title and English Title with a From / To prefix (من and إلى in Arabic), so one row on the grid becomes two boxes on the run screen.

Everything that comes in pairs on the parameter row exists because of this:

  • Default Value fills the from box; Default Value (works with Between) fills the to box. The typed twins work the same way — Date Default Value and Date Default Value (works with Between), and so on for date-and-time, time and reference values.
  • Generated Parameter Name ends up holding both names, separated by a comma — for a Between on the value date it reads FromvalueDate,TovalueDate. That comma pair is not a mistake; it is how the rest of the wizard refers to the two halves.
  • Tick Show as Date Range on a Between over a date and the two separate boxes are replaced by a single from–to range control.

Generated Parameter Name is written for you

You do not fill Generated Parameter Name in — the wizard writes it when you save, from the field path (or the user alias) and the filter type: a parameter on customer with Equals becomes customer_Equals. Whenever something else on the screen needs to refer to a parameter by name, save first and read the name out of this column rather than guessing it.

Default values, including ones that move

A parameter row carries a default value column for each kind of value: Default Value for text, Reference Default Value for a lookup, Date Default Value, Date Time Default Value and Time Default Value — each with its "(works with Between)" twin. Fill the one that matches your parameter's type; when you save, the wizard folds whichever you used into Default Value.

Default Value also understands a family of moving tokens. They are resolved at the moment the run screen opens, not when you build the report, so a report written in January still opens on the right period in December.

TokenResolves to
$today(), $now()Today / the current moment
$monthStart(), $monthEnd()First and last day of the current month
$previousMonthStart(), $previousMonthEnd()The month before
$nextMonthStart(), $nextMonthEnd()The month after
$yearStart(), $yearEnd()First and last day of the current year
$previousYearStart(), $previousYearEnd(), $nextYearStart(), $nextYearEnd()The year before / after
$quarterStart(), $quarterEnd()The current quarter
$halveStart(), $halveEnd(), $thirdStart(), $thirdEnd()The current half-year / third of the year
$todayPlusDays(7), $todayMinusDays(7)A number of days either side of today
$todayPlusWeeks(2), $todayMinusWeeks(2)The same in weeks
$todayPlusMonths(3), $todayMinusMonths(3)The same in months
$todayPlusYears(1), $todayMinusYears(1)The same in years

The pairing readers like most is $monthStart() in Default Value and $today() in Default Value (works with Between): the report opens on month-to-date every time it is run.

Making the reader answer

Required refuses to run until that parameter is filled. Required Group is the softer version: put the same text in the Required Group of several parameters and the reader must fill at least one of them — useful when a report is too heavy to run wide open but there are three or four reasonable ways to narrow it.

The rest of the parameter row

  • Show Inside Report prints the value the reader chose on the report itself, so a printed copy says which period and which branch it covers.
  • Allowed Values turns the parameter into a fixed list of choices, written as a comma-separated list. Arabic Allowed Values and English Allowed Values give those choices readable captions in each language — same count, same order.
  • Reference Entity Type makes the parameter a lookup on that record type, and Filter narrows what the lookup offers. Writing @sysfilter@ inside Filter stands in for the filter the wizard would have applied on its own, so you can add to it instead of replacing it.
  • Source Parameter feeds one parameter from another: name a parameter there and this one stops asking the reader anything and takes the other one's value. For a Between source, give the comma pair. Source Property then picks one property out of that value rather than the whole record.
  • Layout, together with Parameters Position and Number Of Parameters In Row on the group above the grid, arranges the boxes on the run screen.

Custom parameters — asking a question the query does not answer

Sometimes the report needs to ask the reader something that is not a filter on a field at all: a threshold to compare against, a factor to multiply by, a switch that a calculated column reads. That is what Parameter Type = Custom is for.

A custom parameter is a prompt and nothing else. The wizard puts the box on the run screen and honours Required, Allowed Values, Reference Entity Type, Filter and the default value columns exactly as it does for an ordinary parameter — and then adds no condition whatsoever to the report's query. Nothing happens until you use the value somewhere yourself.

Building one takes three steps:

  1. Add a row to Parameters, leave On Field empty, set Parameter Type to Custom and give the row a User Alias (In Case SQL Expression) — that alias is what the parameter will be named after. Set Param Type to the kind of value you want (text, number, date, and so on), and give it Arabic and English titles.
  2. Save, reopen the record, and read the Generated Parameter Name column. That is the name to use in step 3 — remember it is a comma pair if you chose Between.
  3. Use it. There are two places that accept a parameter name:
    • A where line. On the Conditions page, add a row to Where Lines, put the field you want to test in LHS Field Id, choose an Operator, and put the parameter's generated name in Special Value. The report is now filtered by the reader's answer.
    • An expression. Write $P{TheGeneratedName} inside a Custom SQL Expression, the Static Where Condition or the Static Having Condition, and the reader's answer drops straight into the calculation.

The name has to match

Special Value is matched against the parameters the wizard has already built. If it matches none of them, nothing asks the reader for a value and the condition compares against an empty one — so copy the name out of Generated Parameter Name rather than typing what you think it should be.

Columns you calculate yourself

Not every column exists as a stored field. A margin, a difference between two quantities, a label stitched together out of three fields — these you write yourself, and the wizard has a first-class place for them: a row in the Fields grid with On Field left empty.

Such a row is only accepted if it carries something the wizard can turn into a column — a Custom SQL Expression, a Custom Jasper Expression, or Union Handling. Leave all of those empty as well and saving fails, because there is nothing to select.

Writing the expression

Inside Custom SQL Expression you refer to fields by wrapping their path in @{ and }@. The wizard resolves each one, brings in whatever the field needs to be reachable, and substitutes the real column:

(@{in.base.primeQty.value}@ - @{out.base.primeQty.value}@)

You never write table names or aliases — naming the field is enough, and a field you reference only inside an expression does not have to appear as a column of its own.

The Open SQL Expression Editor button on the grid opens this in a proper editor, with the same field tree the picker uses, so you can insert paths by clicking instead of typing them.

Naming and formatting the result

Two more columns matter on a calculated row:

  • User Alias names the column. Give every calculated row one — it is how parameters, sort fields and other expressions refer back to it.
  • Pattern Type decides how the result is treated and formatted: Text, Date, Time, Date Time, Number, Currency or Quantity. If you leave it empty and your expression mentions at least one field, the wizard copies the formatting of the first field you referenced — it sets Pattern Type to Custom From Field and fills Pattern Field with that field. So a difference between two quantity fields comes out formatted as a quantity without you doing anything, while an expression that mentions no field at all needs Pattern Type set by hand.

Everything else on the row behaves as it does for an ordinary column: Arabic Title and English Title, width, style, conditional style, borders.

Totals, aggregation and hidden columns

  • SQL Aggregation TypeSum, Count, Distinct Count, Avg, Min, Max — collapses the report to one row per combination of the columns that are not aggregated. Set it on a calculated column and the aggregate is applied to your whole expression.
  • Has Total In Summary adds a grand total for the column at the end of the report. It produces a total for numeric columns only; on a text or date column the tick has no effect.
  • Hidden keeps the column out of the printed report but keeps it in the query. That is how you sort by, filter on, or calculate from something the reader should not see.

One expression per band

A column can print a different expression depending on where it appears. Press Open Jasper Expression Editor on the field row and the dialog offers an Expression For list: Details Field Expression, Group 1 Header Expression through Group 5 Footer Expression, and Summary. Write an expression against each entry you care about and the report uses that one in that band, falling back to the ordinary column value everywhere you left blank.

This is what lets a column show the row's own value in the detail band but a rate, a percentage or a different aggregate in the group footers. The same dialog offers a function (Sum, Count, Average, Lowest, Highest, Distinct Count, Standard Deviation, Variance, First) and a reset level (Report, Page, Column, Group 1Group 5), so you can build the aggregate rather than write it out.

Reaching data that is not on the main table

A report starts from one main table, and most of what you need hangs off it as an ordinary field path. But some numbers simply are not reachable that way — a total from an unrelated document type, a balance that has to be summed separately, a figure produced by a query somebody has already built. That is what the five Data Source tabs are for.

A data source is its own saved query record. You attach one to the report on the Data Source 1Data Source 5 tab, tell the wizard how its rows line up with the report's rows, and from that moment its fields are available to the report like any other fields.

The $dataSource1. prefix

Once a data source is attached, it appears in the field picker as a branch of its own, labelled with the data source's name. Pick a field under that branch and the wizard writes the path with a prefix that says which data source it came from:

$dataSource1.totalDebit
$dataSource3.lastVisitDate

The number is the tab number — $dataSource1. for the first tab, $dataSource5. for the fifth. Those paths work everywhere an ordinary field path works: as a row in Fields, as a Parameters row so the reader can filter on the data source's own columns, as a sort field, in group lines, and inside @{…}@ in a custom expression. Nothing else about them is special — the prefix simply tells the wizard which query to go and look in.

Lining the data source up with the report

Each data source tab carries two grids, and they do different jobs.

Linking Lines is how the data source's rows are matched to the report's rows — the equivalent of saying "the same customer" or "the same item and the same warehouse". Each line pairs a Data Source Field with either a Reporting Wizard Field (a field on the report's main table) or a Reporting Wizard Parameter (the reader's answer to one of the report's questions). Operator defaults to Equals, which is what you want unless you are matching a range.

Tick Coalesce Null on a linking line when one side may legitimately be empty. Without it a row with an empty value on either side matches nothing at all; with it, empty is treated as a value in its own right and empty matches empty.

Filter Lines narrows the data source itself before the match happens, so it returns less and returns it faster. A filter line pairs a Data Source Field or Data Source Parameter with a value taken from the report — again either a field or a parameter.

Parameters on data-source fields flow inwards

If you add a Parameters row whose On Field starts with $dataSource2., the wizard pushes that condition down into the second data source's own query rather than filtering afterwards. The reader sees one question; the data source comes back already narrowed.

Use Data Source N As Sub Query

By default a data source is worked out once and joined to the report. Tick Use Data Source N As Sub Query and it is evaluated per report row instead, with the linking lines applied inside it as filters. That is the option to reach for when the data source has to be recalculated in the context of each row — a balance as at each document's own date, for example — and the one to leave alone when it does not, because working it out once is far cheaper.

Show All Values

By default a data source can only add to rows the report already has. Start from sales invoices, attach a data source of collections, and a customer who paid but was never invoiced simply is not in the report — there is no invoice row for the collection to attach to.

Show All Values (1)Show All Values (5), on the corresponding data source tab, removes that restriction. Tick it and the wizard stops hanging the data source off the report. Instead it collects every distinct combination of the linking values from both sides — the report's rows and the data source's rows — and uses that combined list as the report's backbone, attaching the report's own data and the data source's data to it afterwards.

The practical result is the one the name promises: a row appears for every value that exists on either side. A customer with invoices and no collections still appears, with the collection columns empty. A customer with collections and no invoices also appears, with the invoice columns empty. Neither side can hide a row from the other.

This is what makes statement-style and comparison reports possible — anything of the shape "show me every account, whether or not it moved this period", "opening balances beside this period's movement", "budget beside actual". Without it those reports quietly lose exactly the rows the reader was looking for.

Two things follow from how it works:

  • The linking lines are what the backbone is built from. A data source with Show All Values ticked and no linking lines has nothing to align on, so fill the lines in first.
  • Coalesce Null earns its keep here. When one side may have an empty linking value — an unallocated entry, a movement with no branch — tick Coalesce Null on that linking line so the empty values on the two sides are treated as the same value and land on one row instead of two.

Reporting on several tables at once

Some questions span document types that share nothing structurally. "Everything that moved this item this month" has to look at issues, receipts, transfers and adjustments; "all money owed to us" spans several kinds of document. Rather than one report per type, the Union Tables grid lets one report read them all and present the result as a single list.

Add a row per extra table to Union Tables and name it in Union Table. The main table stays what it is; the union tables are read alongside it. Every table is queried with the same field list, the same filters and the same parameters, and the results are stacked — nothing is merged or de-duplicated, so a row from the main table and an identical-looking row from a union table both appear.

Every column has to mean something in every table

That stacking is only possible if every column can be produced from every table, and this is the one rule that catches people out. When you save, the wizard checks each field row against the main table and against every union table. If a field path exists on some of them but not all, the save stops and names both the field and the table that is missing it.

That is not an obstacle to work around — it is the question the wizard needs you to answer: what should this column show for the rows that come from that table? You answer it in the Union Handling column.

Union Handling

Select a field row and press Open Union Handling Editor. The dialog lists every table taking part — the main table and each union table — and lets you choose, per table, how that column is produced:

HandlingWhat that table contributes to the column
NormalThe table's own field of that name. This is the default, and it is what stops the save if the table has no such field.
Zero — No ValueNothing: zero for a numeric column, empty for anything else. The right answer when the concept simply does not apply to that table.
NegatedThe table's own value with its sign flipped. This is how one column can hold ins as positive and outs as negative.
Different FieldAnother field of that table, which you pick in the editor. It has to be the same kind of field as the original, and the wizard says so and stops if the two do not match.
Custom EquationAn expression you write for that table alone, using the same @{…}@ field syntax as any other custom expression.

The Negated row is worth dwelling on, because it is the reason unions are used as often as they are. Put the quantity field in one column, set it Normal on the receipt tables and Negated on the issue tables, and the report has a single signed movement column that sums correctly across all of them — instead of two columns the reader has to subtract by eye.

Aggregation works across the whole union rather than per table: if any column carries an SQL Aggregation Type, the wizard sums, counts or averages over the combined result, so a total is a total of everything the report read.

Letting the reader choose which tables are read

A union report that reads eight document types is not always what the reader wants; sometimes they only care about two of them. Include Tables By Parameters, on the main page, turns that into a question on the run screen.

Each row of the grid is one tick-box. Put the tables it governs in Table 1Table 10, give it a Parameter Arabic Title and Parameter English Title — leave those empty and the wizard builds a caption itself out of the names of the tables you listed — and decide its starting state with Do Not Include The Table By Default: left alone, the box starts ticked and those tables are read; ticked, the box starts clear and they are not.

At run time the reader sees one tick-box per row, and the tables behind a box they clear contribute nothing to the result. One row can govern several tables, and you can add as many rows as you need groups.

Converting Quantities by Selected Unit of Measure

In inventory reports, quantities are typically stored in the item's base unit of measure, but users may want to display them in another unit (sales unit, purchase unit, etc.). The Report Wizard provides two complementary options to achieve this.

Option 1: Add a UOMConversion Parameter

This parameter adds a dropdown in the report run screen that allows the user to select the unit of measure, and automatically adds the required joins.

  1. Make sure the report contains a field from the InvItem table (such as item.code) — this is a prerequisite for activating the parameter.
  2. In the Parameters table, add a new row and leave On Field empty, then select Parameter Type = UOMConversion.
  3. Save the report.

When saved, the following are added automatically:

  • A UOM parameter in the JRXML file with values baseUnit, reportingUnit1, defaultPurchaseUnit, defaultSalesUnit.
  • LEFT JOIN UOM AS PrimaryUOM ON PrimaryUOM.id = <InvItem>.prim$P!{UOM}_id
  • LEFT JOIN PrimaryItemUOMLine AS UL ON UL.invItem_id = <InvItem>.id AND UL.uom_id = <InvItem>.prim$P!{UOM}_id

Option 2: Convert a Quantity Field Value to the Selected Unit

After adding a UOMConversion parameter, you can enable conversion on any quantity field independently.

  1. Confirm both conditions are met: the UOMConversion parameter exists + a field from InvItem is in the report.
  2. On the field row you want to convert (such as inBasePValue or a custom expression), tick Use UOM Parameter for Qty Conversion.
  3. Save the report.

The SELECT expression for the field changes to (SUM(field)) / UL.rateToBase, and UL.rateToBase is automatically added to GROUP BY.

TIP

If the two conditions are not met (UOMConversion parameter + InvItem field), the checkbox is silently ignored and no conversion takes place.

JSON for direct import
json
{
  "mainTable": "QtyTransLine",
  "fields": [
    {
      "fieldId": "in.base.primeQty.value",
      "customSqlExpression": "(@{in.base.primeQty.value}@-@{out.base.primeQty.value}@)",
      "useUOMParameterForQtyConversion": true
    },
    { "fieldId": "itemTransRef.item" }
  ],
  "parameters": [
    {
      "userAlias": "PrimaryUOM",
      "parameterType": "UOMConversion"
    },
    {
      "fieldId": "commonData.valueDate",
      "filterType": "Equals"
    }
  ]
}