
BI Reference — EnhancedTable
This page is the reference for the EnhancedTable widget type on the DashBoard Widget screen, including its pivot (cross-tab) layout. Every column, format and colour rule of the table lives in the widget's Chart Config JSON field, so open this page when a table widget shows a column wrongly or a customer wants one changed. The click, drill-down and link settings it shares with the other widgets are in the BI technical reference.
EnhancedTable is the JSON-driven table widget — every column declared in chartConfigJSON with its own formatting, renderer, conditional formatting, pinning, grouping, aggregation. Reuses the BI interaction machinery (clickEmitMapping, drillDownMapping, linkMappings, clickAction — main reference §4–5b) with an optional column field on each entry to scope to a specific cell. Classic Table widget remains; opt in via "type": "EnhancedTable".
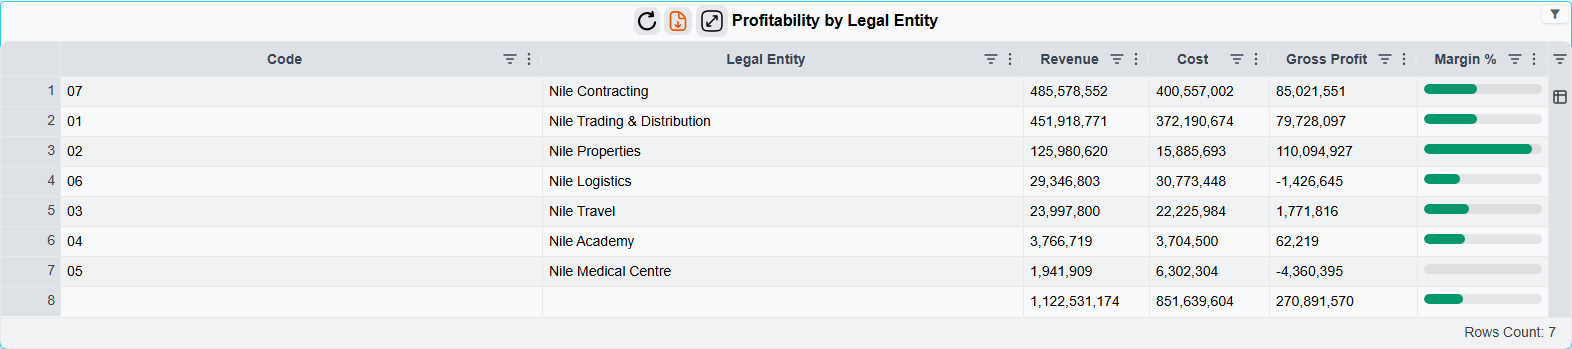
1. chartConfigJSON structure
{
  "tableOptions": { },
  "columnGroups": [ ],
  "columns": [ ],
  "rowConditionalFormatting": { "cascade": false, "rules": [ ] },
  "clickEmitMapping":  [ ],
  "drillDownMapping":  [ ],
  "linkMappings":      [ ],
  "clickAction":       { }
}| Key | Required | Description |
|---|---|---|
columns | Yes | Ordered column definitions (§3 below). Defines grid column order. |
columnGroups | No | Array of {id, headerArTitle, headerEnTitle, marryChildren, openByDefault}. Columns reference via groupId. |
tableOptions | No | Grid-level options (§2). Defaults are reasonable. |
rowConditionalFormatting | No | Per-row formatting (§5). |
clickEmitMapping / drillDownMapping / linkMappings / clickAction | No | Per-cell column field scopes to one column; onCellClick: true fires on left-click. Prefer per-entry onCellClick over widget-level clickAction for tables — see main reference §5a.1. |
No dataMapping / echartOption — EnhancedTable does not use ECharts.
2. tableOptions
"tableOptions": {
  "pagination":         false,
  "pageSize":           25,
  "pageSizes":          [25, 50, 100, 250],
  "rowNumbers":         true,
  "enableRowGroup":     true,
  "enablePivot":        false,
  "pivotOpenByDefault": false,
  "grandTotalRow":      "bottom",
  "defaultColWidth":    null,
  "defaultFlex":        1,
  "defaultMinWidth":    130,
  "wrapText":           true,
  "autoHeight":         true,
  "enableRtl":          "auto",
  "cellSelection":      true,
  "rowModel":           "clientSide",
  "serverPageSize":     100
}| Field | Default | Notes |
|---|---|---|
pagination | false | Off by default — load-all-and-scroll. When on, AG Grid paginates the in-memory data. For paging on the server, use rowModel instead (§2.1). |
grandTotalRow | null | "top" / "bottom" / null. Computed client-side from visible rows. Only columns with aggFunc set show a value in the grand-total row — others render blank. |
enableRowGroup / enablePivot | true / false | AG Grid row-grouping / pivot modes. Columns need rowGroup: true / pivot: true to be grouped/pivoted by default. |
groupDefaultExpanded | -1 in pivot mode | How many grouping levels are open on load; -1 expands every level. The server fills in -1 for pivot widgets that don't set it, because collapsed groups make a fresh cross-tab look empty. Set it yourself to override. |
groupIncludeFooter | true when pivot row subtotals are on | Adds a subtotal footer row under each group. Set it explicitly to force it on or off. |
rowModel | "clientSide" | "clientSide" sends every row to the browser. "serverSide" keeps the rows on the server and sends one page at a time — see §2.1. Designer label: Row Loading. |
serverPageSize | 100 | Page size used when rowModel is "serverSide". One of 25, 50, 100, 250, 500, 1000, 2500, 5000, 50000. Ignored in client-side mode, where pageSize applies. |
2.1 Server-side paging (rowModel: "serverSide")
A table with tens of thousands of rows is slow to open when every row travels to the browser. With rowModel: "serverSide" the widget query still runs once, exactly as before, but the server keeps the built rows and the grid asks for one page at a time. Sorting, column filters and the filter value lists are all answered by the server against the full result, so they behave as they would on the complete data.
In the designer this is Table Options → Row Loading → Load page by page from the server, with a Page Size (server paging) box next to it.
When it is ignored. Server paging needs a table the server can cut into pages without the browser seeing the whole result. The widget quietly falls back to the normal client-side mode when any of these is true:
- a
pivotblock is set (§8); grandTotalRowis set, orgroupIncludeFooteristrue;- any column has
rowGroup: true,pivot: trueor anaggFunc.
The designer shows this rule under the Row Loading box: Server paging is not used when the table has a pivot, row grouping, aggregation or total rows.
What changes for the user in server mode:
- Pagination is always on; the page-size picker offers the list above.
- Row grouping and pivot are not offered: columns cannot be dragged into groups, and the Columns panel has no pivot mode.
- Clicks, cross-filter emission, drill-down, drill-by and record links work as in client-side mode.
- Export to Excel exports every row that matches the current filters and sort, not just the loaded page.
- The rows stay on the server for 15 minutes without use. After that (or after a server restart), the next page request makes the widget re-run its query and reload by itself. The cache is shared by all users and capped at one million rows in total by default (system property
nama.bi.enhancedTable.maxCachedRows); when it is full, the least recently used tables are dropped first and reload the same way. - The admin Copy Data JSON button shows an empty
rowsarray plus aserverSideentry carrying the row count, because the rows are no longer in the browser.
3. Column definition
{
  "id":            "amountCol",
  "field":         "netValue",
  "wizardFieldId": "price.netValue",
  "groupId":       "salesGroup",
  "headerArTitle": "الصافي",
  "headerEnTitle": "Net Value",
  "hide":          false,
  "width":         120,
  "minWidth":      80,
  "maxWidth":      240,
  "flex":          null,
  "pinned":        null,
  "sort":          null,
  "sortIndex":     null,
  "rowGroup":      false,
  "rowGroupIndex": null,
  "pivot":         false,
  "aggFunc":       "sum",
  "tooltipField":  null,
  "formatting":    { },
  "renderer":      { },
  "conditionalFormatting": { }
}| Field | Required | Description |
|---|---|---|
id | Yes | Stable identifier. Used by mappings (column field), compareColumn, AG Grid column ID. |
field | One of | SQL column name from widget's dataSource. |
wizardFieldId | One of | Wizard field ID (wizard mode). Resolved via cached displayAlias. See bi-reference-wizard-mode.md. |
groupId | No | References columnGroups[].id. |
headerArTitle / headerEnTitle | No | Localized header. Falls back to id. |
hide, width, minWidth, maxWidth, flex | No | AG Grid layout. |
pinned | No | "start" / "end" / null. Logical pinning that flips with reading direction. |
sort, sortIndex | No | Initial sort. |
rowGroup, rowGroupIndex, pivot, aggFunc | No | Aggregation. aggFunc: "sum", "avg", "min", "max", "count", "first", "last". |
tooltipField | No | id of another column whose display value is this cell's tooltip. |
formatting | No | §4.1 below. |
renderer | No | §4.2 below. Defaults to text. |
conditionalFormatting | No | §5 below. |
4. Formatting & renderers
4.1 formatting
Server-computed display string; client uses verbatim.
"formatting": {
  "type":              "currency",
  "decimals":          2,
  "thousandSeparator": true,
  "currencyCode":      "SAR",
  "currencySymbol":    "SAR",
  "currencyPlacement": "suffix",
  "dateFormat":        "yyyy-MM-dd",
  "percentScale":      "asIs",
  "nullDisplay":       "—",
  "prefix":            "",
  "suffix":            ""
}
type | Output | Extra options |
|---|---|---|
text | unchanged | — |
number | 1,234.50 | decimals, thousandSeparator |
currency | 1,234.50 SAR | decimals, currencySymbol, currencyPlacement (prefix/suffix) |
percent | 45.00% | decimals, percentScale (asIs: 45→45%; fraction: 0.45→45%) |
date | 2026-04-19 | dateFormat (SimpleDateFormat, default yyyy-MM-dd) |
datetime | 2026-04-19 14:30 | dateFormat (default yyyy-MM-dd HH:mm) |
duration | 1:23:45 | seconds input |
prefix/suffix wrap the formatted string. nullDisplay replaces empty values (default "").
Note: The currency-symbol field here is currencySymbol. The ECharts dataMapping.series[].format block uses currency instead — they are not interchangeable. See main reference §7.
4.2 renderer
"renderer": {
  "type": "text" | "html" | "badge" | "bar" | "sparkline" | "progress" | "icon",
  "badge":    { "shape": "pill" | "square", "variant": "solid" | "outline" },
  "bar":      { "min": 0, "max": 100, "color": "#4caf50", "style": "simple" | "interactive" },
  "progress": { "min": 0, "max": 100, "style": "simple" | "interactive" },
  "icon":     { "mapping": [ { "when": "Approved", "icon": "check_circle", "color": "#2e7d32" } ], "position": "prefix" | "replace" },
  "sparkline":{ "type": "line" | "column" | "area", "lineColor": "#2196F3", "fill": "rgba(33,150,243,0.2)" }
}
The style field on bar and progress selects the rendering engine:
style | Visual |
|---|---|
simple (default) | Pure CSS div + colored fill — lightweight, no chart engine, crisp at any size |
interactive | ECharts horizontal bar with hover tooltip |
Sparklines always render via ECharts (mini line / area / column with hover tooltip); there is no style option.
Mixing simple and interactive in one row is supported and often useful — e.g., a CSS-bar invoiced % next to an interactive ECharts revenue bar visually signals which one rewards exploration.
| Type | Visual | Notes |
|---|---|---|
text | Plain string | Default. No renderer block needed. |
html | Raw HTML via v-html | Trust model matches legacy Param_INHTML — no client sanitization. Export to Excel and the column filter use the cell's visible text: tags, scripts, styles and hidden elements are dropped and <br> becomes a line break. |
badge | Pill/square with cell text | bg/color come from conditionalFormatting; falls back to subtle blue. outline variant pairs with conditional bg for tinted-pill effect. |
bar | Horizontal filled bar (CSS by default, ECharts when style: "interactive") | Value scaled min→max. max is optional — when omitted, renderer auto-scales to the column's data max (the common pattern). |
progress | Same mechanism as bar, blue fill | Semantically "progress toward target". |
sparkline | Mini multi-point ECharts chart | Reads series from the column's own SQL field — CSV string 1,5,9,12 or JSON array [1,5,9,12]. |
icon | Cell value matched against mapping[].when | Matched entry renders an icon (replaces text when position: "replace"). |
5. Conditional formatting
Rules evaluated server-side; winning style baked into the wire payload — client does zero rule evaluation.
"conditionalFormatting": {
  "cascade": false,
  "rules": [
    { "when": { "type": "threshold", "op": ">=", "value": 1000 },
      "style": { "bg": "#e8f5e9", "color": "#1b5e20", "bold": true } },
    { "when": { "type": "threshold", "op": "<", "value": 0 },
      "style": { "bg": "#ffebee", "color": "#b71c1c", "bold": true } },
    { "when": { "type": "range", "min": 0, "max": 100, "maxExclusive": true },
      "style": { "bg": "#fff3e0" } },
    { "when": { "type": "enum", "values": ["Cancelled", "Rejected"] },
      "style": { "bg": "#eeeeee", "italic": true } },
    { "when": { "type": "compareColumn", "op": ">", "column": "budgetCol" },
      "style": { "bg": "#ffebee", "color": "#b71c1c" } },
    { "when": { "type": "isNull" },
      "style": { "italic": true, "color": "#9e9e9e" } }
  ]
}
Rule types:
type | Operands | Comparison |
|---|---|---|
threshold | op, value | Numeric (or date if column's formatting.type is date/datetime). Coerces both sides; rule misses if coercion fails — never falls through to string. |
range | min, max, minExclusive?, maxExclusive? | Same coercion. |
compareColumn | op, column (another column's id) | Compare to another cell on same row. |
enum | values[] | Case-sensitive string equality on trimmed cell value. |
isNull / isNotNull | — | Tests raw value before coercion. |
Operators: >, >=, <, <=, =, !=.
cascade: false (default) → first match wins, evaluation stops. true → every match merges on top of previous (later keys override).
Traffic-light recipe: with cascade: false (default), order rules tightest first so the most-extreme condition wins:
"rules": [
  { "when": { "type": "threshold", "op": "<",  "value": 0   }, "style": { "bg": "#991b1b", "color": "#ffffff", "bold": true } },
  { "when": { "type": "threshold", "op": "<=", "value": 30  }, "style": { "bg": "#fecaca", "color": "#991b1b", "bold": true } },
  { "when": { "type": "threshold", "op": "<=", "value": 60  }, "style": { "bg": "#fde68a", "color": "#92400e" } },
  { "when": { "type": "threshold", "op": ">",  "value": 60  }, "style": { "bg": "#bfdbfe", "color": "#1e40af" } }
]
Style vocabulary (no raw CSS — small fixed set):
| Key | CSS |
|---|---|
bg | background-color — kept as authored while it contrasts with the theme's text, otherwise drawn as a tint (§5.1) |
color | color |
bold | font-weight: 700 |
italic | font-style: italic |
underline | text-decoration: underline |
border | border (shorthand, trusted string) |
align | text-align (start/center/end) |
5.1 Backgrounds and dark mode
The dashboard follows the user's light/dark theme, but a colour written into a rule is fixed. A pale fill chosen while looking at the light theme (#fff8e1, #e8f5e9, …) becomes light-on-light — and unreadable — the moment the dashboard is opened in dark mode; a dark fill has the same problem in light mode. The widget resolves that per theme:
bgon its own is painted exactly as written as long as the theme's text colour still contrasts with it. Light-mode pastels pass that test, so existing dashboards look unchanged in light mode. When the contrast is too low — a pastel in dark mode, a dark fill in light mode — the same colour is painted as a tint instead, composited over the grid at 22% opacity. A pale cream row therefore becomes a dark amber band in dark mode, keeping its hue while the theme's own text colour stays readable. Nothing to configure per theme.bgtogether withcoloris applied verbatim, both keys, with no adjustment: you have taken control of the pair and are responsible for checking it in both themes. Use this for solid chip styling such as{ "bg": "#2e7d32", "color": "#ffffff" }, which reads correctly either way because it carries its own text colour.coloron its own, with nobg, is treated the same way from the other side: kept as written while it still reads on the grid's own background, and otherwise walked towards the theme — lighter in dark mode, darker in light mode — in steps that keep its hue. A dark green#1b5e20stays exactly that in light mode and becomes a legible sage green in dark mode.- A colour that already carries transparency —
rgba(...)with an alpha argument, or 4-/8-digit hex — passes through untouched: you have already chosen the strength of the tint yourself. So does anything with no fixed colour to reason about, such asvar(...)orcolor-mix(...).
Any CSS colour notation works for bg and color — hex, rgb(), rgba(), hsl(), or a colour name like lightyellow.
So: give bg alone and let the widget cover both themes (the safe default), or give bg and color together and check both themes yourself.
The badge renderer is unaffected — its pills always supply their own text colour (§4).
5.2 rowConditionalFormatting
Same vocabulary, applied per row. Each rule must name the test column via when.column — there is no implicit "this cell". Winning style applied to whole row via AG Grid's getRowStyle.
"rowConditionalFormatting": {
  "cascade": false,
  "rules": [
    { "when": { "type": "threshold", "column": "marginCol", "op": "<", "value": 0 },
      "style": { "bg": "#ffebee" } },
    { "when": { "type": "enum", "column": "statusCol", "values": ["Cancelled"] },
      "style": { "bg": "#fafafa", "italic": true } }
  ]
}
6. Complete example
{
  "tableOptions": {
    "pagination": false, "rowNumbers": true,
    "enableRowGroup": true, "grandTotalRow": "bottom"
  },
  "columnGroups": [
    { "id": "customerGroup", "headerArTitle": "بيانات العميل", "headerEnTitle": "Customer", "marryChildren": true }
  ],
  "columns": [
    { "id": "invoiceCode",  "field": "invoiceCode",  "headerArTitle": "الفاتورة", "headerEnTitle": "Invoice", "pinned": "start", "width": 120 },
    { "id": "valueDate",    "field": "valueDate",    "headerArTitle": "التاريخ",  "headerEnTitle": "Date", "formatting": { "type": "date" }, "width": 110 },
    { "id": "customerName", "field": "customerName", "groupId": "customerGroup", "headerArTitle": "العميل", "headerEnTitle": "Customer" },
    { "id": "branchName",   "field": "branchName",   "groupId": "customerGroup", "headerArTitle": "الفرع",  "headerEnTitle": "Branch" },
    { "id": "qty", "field": "qty", "headerArTitle": "الكمية", "headerEnTitle": "Qty",
      "formatting": { "type": "number", "decimals": 0 },
      "renderer":   { "type": "progress", "progress": { "min": 0, "max": 50 } },
      "aggFunc": "sum", "width": 140 },
    { "id": "netValue", "field": "netValue", "headerArTitle": "الصافي", "headerEnTitle": "Net",
      "formatting": { "type": "currency", "decimals": 2, "currencySymbol": "SAR" },
      "aggFunc": "sum",
      "conditionalFormatting": { "rules": [
        { "when": { "type": "threshold", "op": ">=", "value": 10000 }, "style": { "bg": "#e8f5e9", "color": "#1b5e20", "bold": true } },
        { "when": { "type": "threshold", "op": "<",  "value": 0 },     "style": { "bg": "#ffebee", "color": "#b71c1c", "bold": true } }
      ] } },
    { "id": "tier", "field": "tier", "headerArTitle": "الفئة", "headerEnTitle": "Tier",
      "renderer": { "type": "badge", "badge": { "shape": "pill" } },
      "conditionalFormatting": { "rules": [
        { "when": { "type": "enum", "values": ["High"] },   "style": { "bg": "#2e7d32", "color": "#ffffff" } },
        { "when": { "type": "enum", "values": ["Medium"] }, "style": { "bg": "#f9a825", "color": "#ffffff" } },
        { "when": { "type": "enum", "values": ["Low"] },    "style": { "bg": "#9e9e9e", "color": "#ffffff" } }
      ] } }
  ],
  "rowConditionalFormatting": { "rules": [
    { "when": { "type": "threshold", "column": "netValue", "op": ">=", "value": 50000 }, "style": { "bg": "#fff8e1", "bold": true } }
  ] },
  "clickEmitMapping": [
    { "crossFilterCode": "customerFilter", "column": "customerName", "valueColumn": "customerName" }
  ]
}
7. Migration from Table
No automatic upgrade. Per-widget opt-in:
- Change
typefromTabletoEnhancedTable. - Open chart-config editor → Table Columns tab → click Generate Columns From Result Set.
- Customize formatting / renderers / conditional formatting.
Existing clickEmitMapping / drillDownMapping / linkMappings continue to work — column matches auto-generated column ids (which default to the SQL column name).
8. Pivot (cross-tab) layout
Pivot mode turns an EnhancedTable into a JasperReports-style cross-tab: row dimensions become row groups, column dimensions become nested column-group headers, measures fill cell intersections — with optional subtotals at each level and a grand total. The hand-authored columns block is ignored when pivot is set; the engine synthesizes columns + nested groups + row plan server-side.
8.1 Configuration
{
  "pivot": {
    "rowDimensions":      [ { "field": "sCode", "headerEnTitle": "Section" }, { "field": "iCode", "headerEnTitle": "Item" } ],
    "colDimensions":      [ { "field": "bCode", "headerEnTitle": "Branch" }, { "field": "wCode", "headerEnTitle": "Warehouse" } ],
    "measures": [
      { "field": "netQty",  "headerEnTitle": "Qty",  "aggFunc": "sum", "formatting": { "type": "number",   "decimals": 2 } },
      { "field": "netCost", "headerEnTitle": "Cost", "aggFunc": "sum", "formatting": { "type": "currency", "decimals": 2, "currencySymbol": "SAR" } }
    ],
    "useRowGrouping":     true,
    "rowSubtotals":       true,
    "colSubtotals":       true,
    "rowGrandTotal":      "bottom",
    "colGrandTotal":      "end",
    "subtotalLabelKey":   "biSubtotal",
    "grandTotalLabelKey": "biGrandTotal",
    "emptyCellAs":        null,
    "zeroAsEmpty":        true
  }
}| Field | Default | Notes |
|---|---|---|
rowDimensions | required | Ordered, outermost first. Each: field (raw SQL alias) or wizardFieldId, optional headers + formatting. |
colDimensions | required | Same shape; ordering controls header nesting. |
measures | required | Each: field/wizardFieldId, headers, aggFunc (default sum; v1 supports sum only), formatting, optional conditionalFormatting (applied to leaf, subtotal, and grand-total columns derived from this measure). |
useRowGrouping | true | When true and ≥2 row dims, outer N-1 dims become AG Grid row groups; innermost is the leaf row. With one row dim, grouping is a no-op — backend falls back to flat rows + baked subtotal/grand-total rows. |
rowSubtotals | false | Per-group subtotal footer rows. With grouping active → AG Grid renders client-side. Without → backend bakes them in. |
colSubtotals | false | Subtotal columns at each non-leaf col-dim level. Always backend-rendered (AG Grid can't synthesize cross-tab columns). |
rowGrandTotal | null | "top" / "bottom" / null. With grouping: AG Grid grandTotalRow. Without: baked into result set. |
colGrandTotal | null | "start" / "end" / null. Logical — start = leading edge in either reading direction. |
subtotalLabelKey / grandTotalLabelKey | hardcoded | i18n keys; frontend resolves via Translator.translate(). Falls back to Subtotal / Grand Total (and Arabic). |
emptyCellAs | null | What no-data cells render: null (blank), 0, "-", etc. |
zeroAsEmpty | false | Measure aggregating to exactly 0 → render as emptyCellAs. |
8.2 What the engine emits
Walks rows once, builds distinct row-tuple/col-tuple trees (alphabetically sorted per level), re-aggregates (rowTuple, colTuple) → measures via sum, emits:
- Synthetic
columns: M row-dim columns (pinnedstart) + leaf measure columns interleaved with col-subtotal columns (per non-leaf prefix) + col grand-total columns at chosen end. Stable IDs likepv:bCode=B1.wCode=W1:m=netQty. - Nested
columnGroupswithparentGroupId: one per non-leaf col-tuple prefix. - Synthetic rows: with grouping, only leaf data rows; without, leaf + subtotal + grand-total rows interleaved.
enhancedTableData.styles: total rows/cols tagged viatflag (0=grand,n>0=subtotal at depthn); default bold + tint applied. ExplicitconditionalFormattingalways wins.agColumnCellDataTypes: every measure column tagged"number"so cell values flow as JSON numbers (required foraggFuncaggregations on group rows).
8.3 Wizard mode
In wizard mode (widget has wizardDataSource), use wizardFieldId instead of field on every dim/measure. WizardChartConfigRewriter resolves to cached SQL alias (displayAlias) before the engine runs.
8.4 Interaction skipping on totals
Subtotal and grand-total rows + columns are derived aggregates with no underlying source row, so click-emit / drill-down / link / drill-down-by all skip them. Detected via t flag on row data (_totalLevel) and column config (t). Cursor hint also disabled.
8.5 Coexistence with AG Grid client-side pivot
tableOptions.enablePivot (drag-pivot at runtime) is unrelated and stays untouched. Use it for free-form exploration; use the pivot block for author-defined cross-tab reports.
8.6 Complete pivot example
select w.code wCode, b.code bCode, i.code iCode, s.code sCode,
       sum(q.net) netQty, sum(q.netCost) netCost
from   ItemDimensionsQty q
left join InvItem      i on i.id = q.item_id
left join ItemSection  s on s.id = i.section_id
left join Warehouse    w on w.id = q.warehouse_id
left join Branch       b on b.id = w.branch_id
group by w.code, b.code, i.code, s.code{
"pivot": {
"rowDimensions": [
{ "field": "sCode", "headerEnTitle": "Section", "headerArTitle": "القسم" },
{ "field": "iCode", "headerEnTitle": "Item", "headerArTitle": "الصنف" }
],
"colDimensions": [
{ "field": "bCode", "headerEnTitle": "Branch", "headerArTitle": "الفرع" },
{ "field": "wCode", "headerEnTitle": "Warehouse", "headerArTitle": "المخزن" }
],
"measures": [
{ "field": "netQty", "headerEnTitle": "Qty", "headerArTitle": "الكمية", "aggFunc": "sum", "formatting": { "type": "number", "decimals": 0 } },
{ "field": "netCost", "headerEnTitle": "Cost", "headerArTitle": "التكلفة", "aggFunc": "sum",
"formatting": { "type": "currency", "decimals": 2, "currencySymbol": "SAR" },
"conditionalFormatting": { "rules": [
{ "when": { "type": "threshold", "op": ">=", "value": 1000000 }, "style": { "bold": true, "color": "#1b5e20" } }
] } }
],
"useRowGrouping": true, "rowSubtotals": true, "colSubtotals": true,
"rowGrandTotal": "bottom", "colGrandTotal": "end",
"zeroAsEmpty": true, "emptyCellAs": "-"
}
}