
BI Module — Dashboards & Analytics
Nama ERP's BI module lets you build interactive dashboards that turn your live ERP data into charts, gauges, tables, and more. Charts talk to each other through cross-filters, drill-down popups, and direct links — so your dashboards aren't just static pictures, they're exploration tools your team can click through to find answers.
This guide walks you through everything the BI module can do, from the chart designer to advanced interactions like drill-down and cross-filtering. If you're looking for the JSON structures, SQL patterns, and import formats needed to build dashboards programmatically, see the Technical Reference.
What You Get
A typical BI setup in Nama ERP looks like this:
- Dashboards — grid layouts that hold multiple widgets side-by-side
- Widgets — individual charts, tables, or cards that each pull data from a SQL query
- Cross-Filters — shared filter parameters (branch, date range, customer, etc.) that slice data across all widgets at once
- Drill-Down — click a data point to open a related chart or dashboard, pre-filtered to that point's context
- Links — click a data point to jump straight to the underlying record (e.g., open the customer's edit screen)
Here is one of them running:
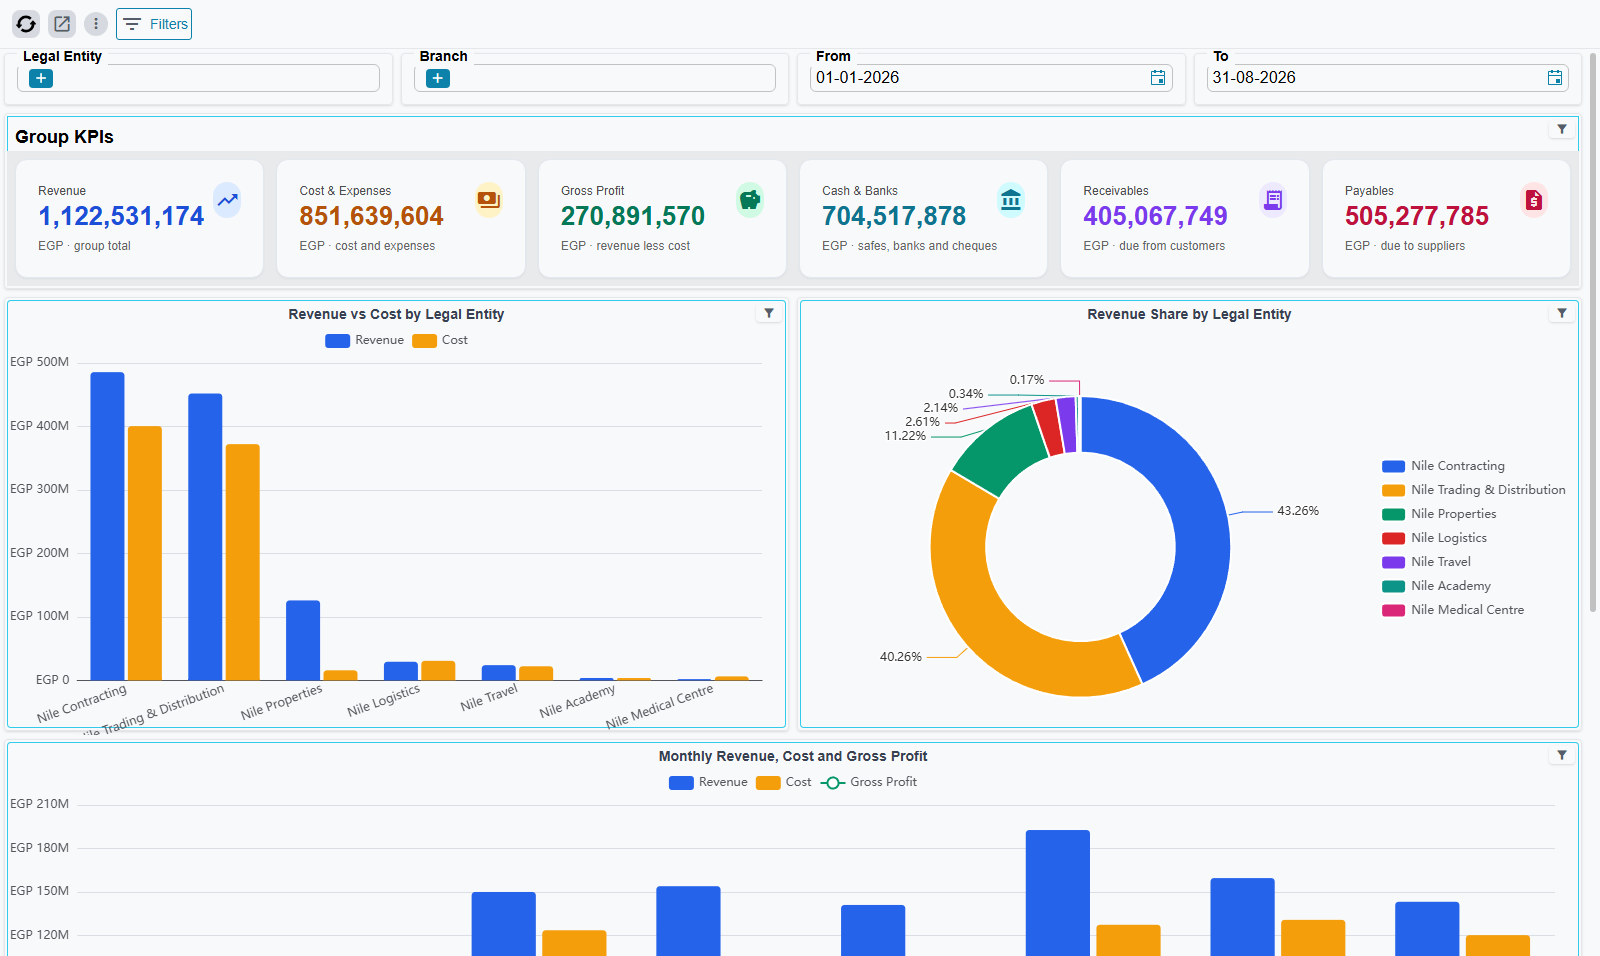
Dashboards are rendered on the Home page — that is where users meet them day to day. To open a specific one while you are setting it up, open its dashboard record and press Open Dashboard in the action bar. Once the dashboard is on screen, its own toolbar carries Refresh, Open Dashboard, View Options (the ⋮ button) and Filters.
Chart Types
The module ships with 41 ready-to-use chart templates organized into 11 categories. You don't need to configure ECharts JSON from scratch — pick a template, point it at your data, and customize the look.
Bar Charts (10 templates)
Single bar, grouped bars (side-by-side comparison), stacked, 100% stacked, horizontal, horizontal stacked, positive/negative bars, waterfall, prior-period comparison, and ranked horizontal bars with descending sort.
Line Charts (6 templates)
Single line, multi-series, step line (values stay constant between points), dual Y-axis (for comparing different scales — e.g., revenue vs. quantity), line with a dashed target reference line, and line with a data-zoom slider for large date ranges.
Area Charts (4 templates)
Basic area, stacked area, gradient-fill area, and range/band area.
Pie & Donut Charts (7 templates)
Standard pie, donut, donut with center label, rose/sunburst pie (wedge size by area, not angle), half-circle pie, nested two-level pie, and a nested two-level pie with rich labels.
Gauge Charts (4 templates)
Standard speedometer gauge, progress gauge, ring gauge, and multi-ring gauge (multiple concentric indicators).
Combination Charts (2 templates)
Mixed bar + line, and mixed bar + area — useful when you want to show totals as bars and a trend line on the same chart.
Scatter & Bubble (2 templates)
XY scatter plot and bubble chart (bubble size encodes a third dimension).
Radar Charts (2 templates)
Polygon radar and filled radar — great for comparing multiple metrics across categories (e.g., KPI scorecards).
Funnel Charts (2 templates)
Standard funnel (conversion stages) and comparison funnel.
Treemap (1 template)
Hierarchical rectangle chart for part-to-whole relationships.
Heatmap (1 template)
Matrix visualization with color intensity — useful for time-of-day patterns, region × product analysis, and similar two-dimensional breakdowns.
The Chart Designer
The chart designer is the dialog you open when you create or edit a widget's chart configuration.
It is not reachable from the dashboard itself. To get to it, open the widget's own record — either through Open Widget in the chart's toolbox, or by opening the Dashboard Widget screen and finding the widget by its code — and then press the Edit Chart Config action on the record's Main tab.
The designer has two states:
State A — Template Gallery
When you start with a blank widget, the designer opens in gallery mode. You see a searchable grid of all 41 templates, each rendered as a live mini-chart so you can see exactly what you're picking.
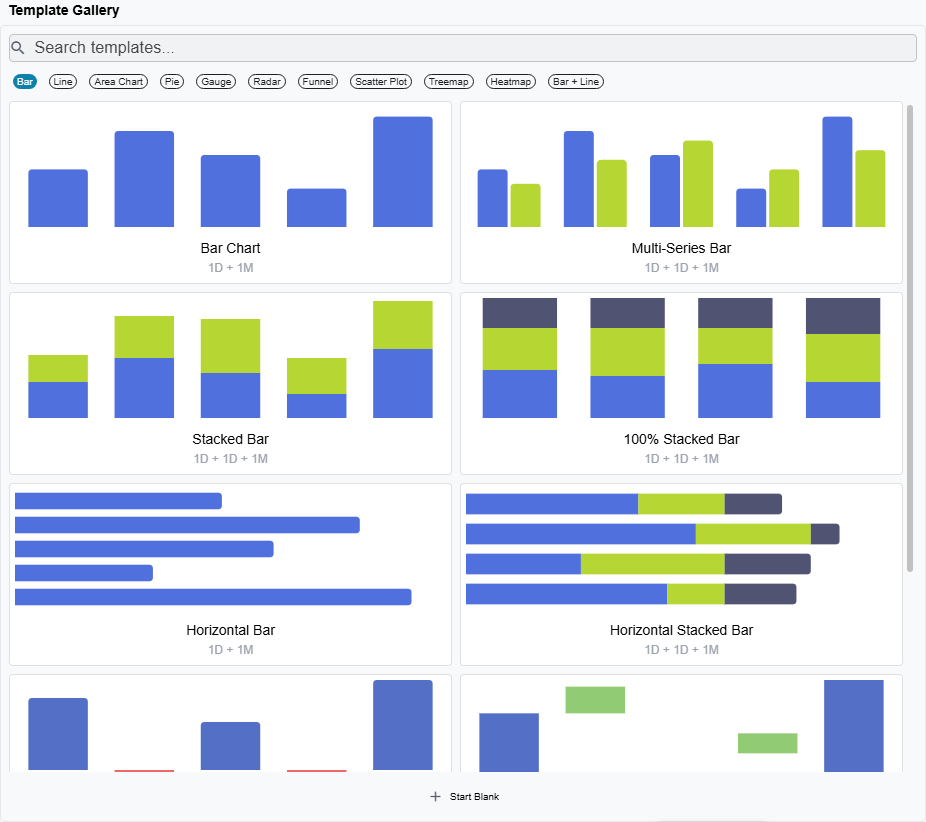
From the gallery you can:
- Search by name (e.g., type "stacked" to filter to stacked variants)
- Filter by category using the chips at the top (Bar, Line, Pie, etc.)
- Click a template to select it and move to the editor
- Start Blank if you want to build a chart from an empty canvas
State B — Chart Editor
Once you've picked a template (or opened an existing widget), you land in the editor. This is where you connect your data, style the chart, and configure interactions. The editor is split into a form area on the left and a live preview on the right — every change you make updates the preview in real time.
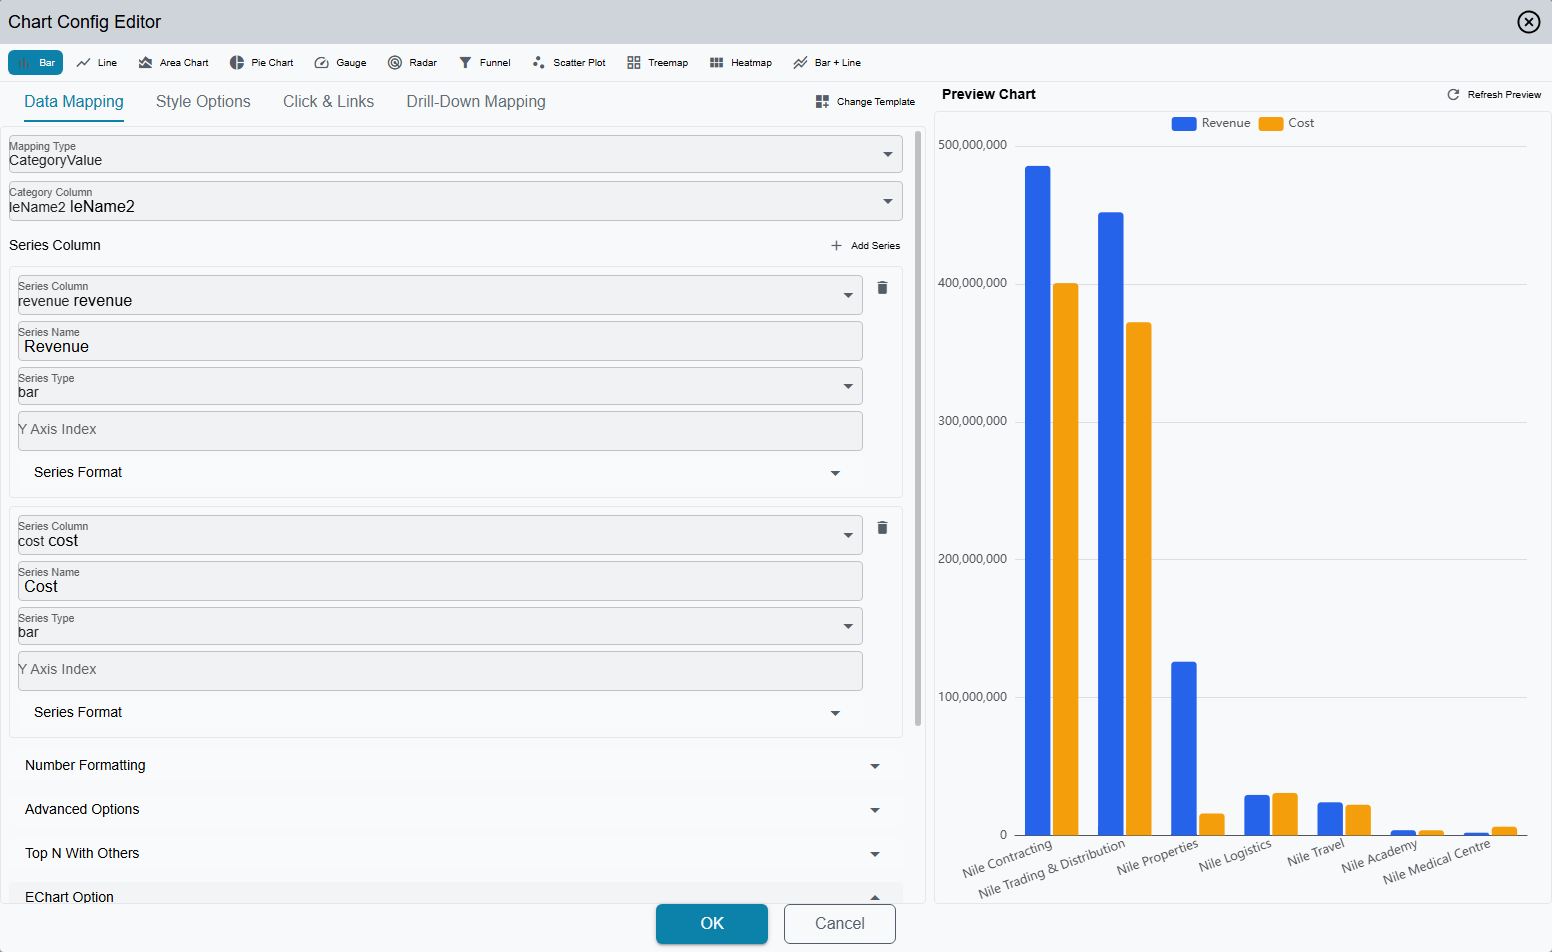
At the top of the editor, a chart type bar shows 11 icon buttons (one per chart category). Clicking one switches the chart type while keeping your data mapping intact where possible.
The form area has four tabs — Data Mapping, Style Options, Click & Links and Drill-Down Mapping — plus a Change Template button that takes you back to the gallery. The first tab changes with the widget type: Enhanced Table widgets show Table Columns where Data Mapping would be, and metrics-card widgets show Card Template and have no preview pane at all.
A Text Block widget skips all of that. Its designer is a single content pane: a rich-text editor with an Arabic Text / English Text tab pair above it, a collapsible Raw HTML box for pasting markup straight in, and a frame-style grid underneath (background and text colour, padding, border colour/width/radius, default font size, alignment). Write the block in one language and leave the other empty and the same text serves both; fill both in and each language reads its own.
Data Mapping Tab
This is where you tell the chart which data fields to use.
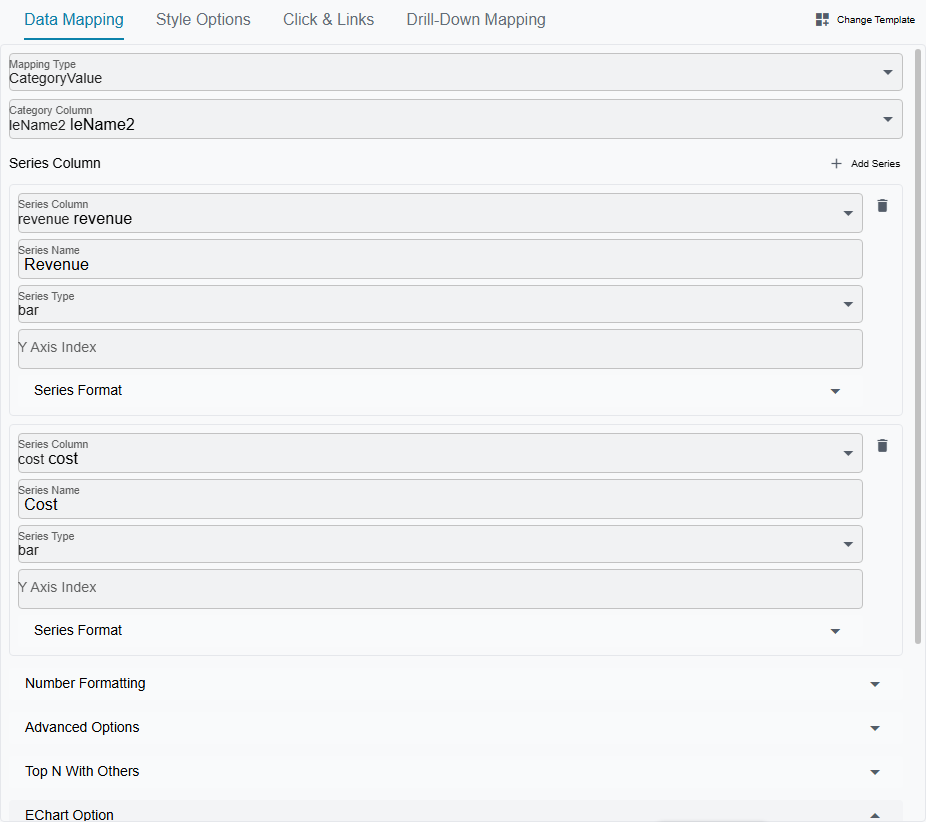
The available fields depend on the data mapping type (which is set automatically by your template choice, but can be changed):
- Category column — the dimension that goes on the X-axis (e.g., branch name, month)
- Series — one or more value columns, each with a name, chart type (bar/line/scatter), number format, and optional Y-axis assignment
- Label column — for pivot-style charts where distinct values in one column become separate series automatically
- Stack / Percent mode — turn grouped bars into stacked bars, or normalize to 100%
- Sort order — ascending or descending by value
The pickers behave differently depending on whether the widget uses a raw SQL data source or a wizard data source:
- SQL data source — you pick from the result-set column names returned by your query (plus any tempo columns and period-comparison columns you've defined).
- Wizard data source — you pick from the wizard's field IDs directly. Each option shows the translated title plus the raw field ID in parentheses (so
customerandupperInvoice.customerare distinguishable even when they both translate to "Customer"). Tempo columns and period-comparison columns still appear in the same picker but under separate groups.
Wizard-mode charts get several designer-level shortcuts:
- The category, label, value, X, Y, and series slots accept a wizard field ID — the backend resolves the correct SQL alias at render time.
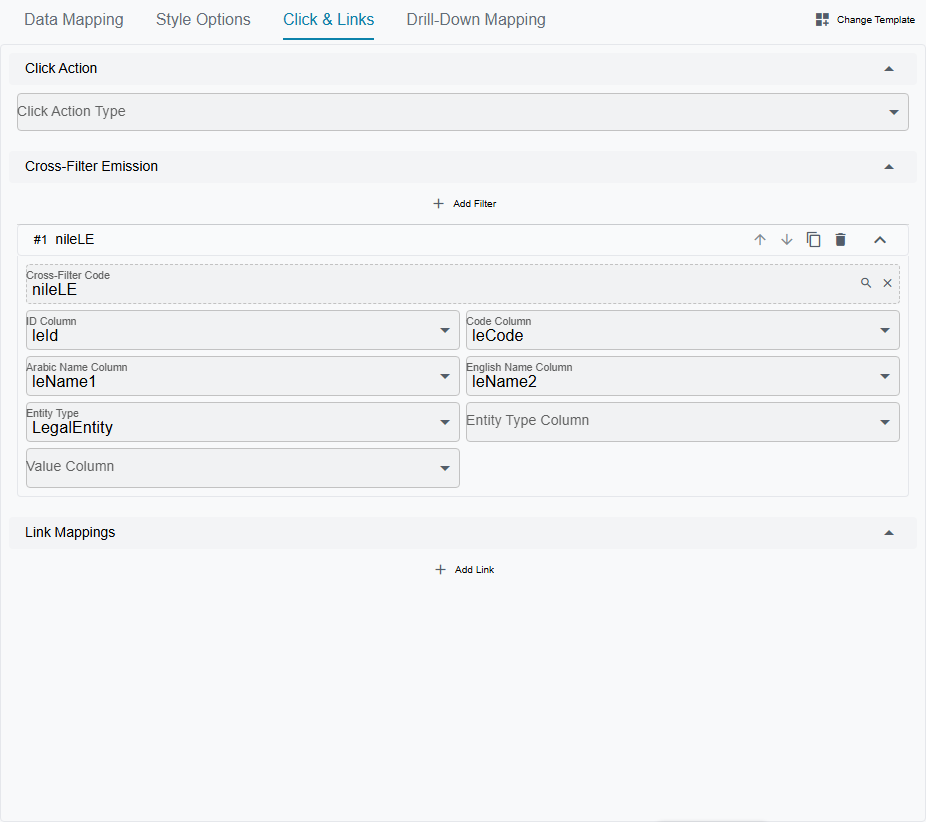
- Cross-filter emission entries only need the target cross-filter and the wizard field ID; the id/code/name/entityType columns are auto-inferred from the field's metadata.
- The Click & Links tab and the Drill-Down tab show an Active Dimension selector when in wizard mode. Each dimension gets its own set of cross-filter and drill-down entries, and a "Copy from Dimension" button clones entries from another dimension to bootstrap new configurations.
Style Options Tab
Visual customization without touching JSON.
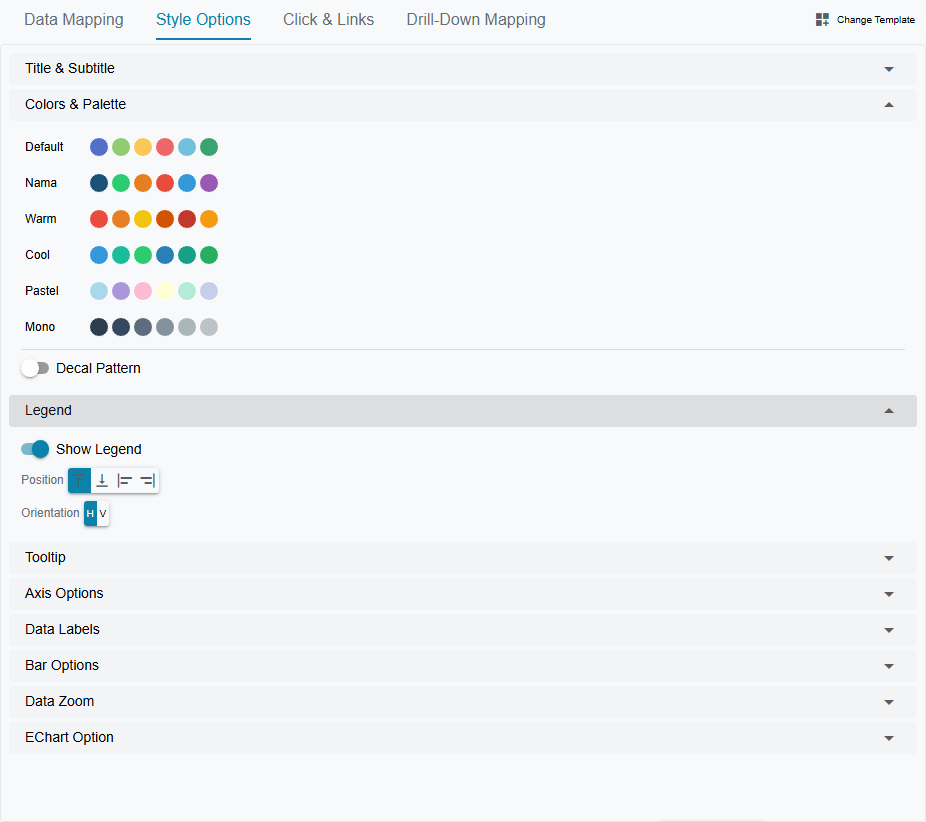
The controls sit in collapsible sections:
- Title & subtitle — show/hide, text, position
- Color palette — six built-in palettes (default, warm, cool, pastel, monochrome, Nama brand), plus a custom color picker for individual series
- Decal patterns — hatching/patterns for accessibility and black-and-white printing
- Legend — show/hide, position (top/bottom/left/right), orientation
- Tooltip — show/hide, trigger mode (axis shows all series at once, item shows one data point)
- Axes — label rotation, inverse direction, min/max bounds, grid lines
- Data labels — show/hide, position (top/bottom/inside/center)
- Data zoom — slider or mouse-wheel zoom for scrollable charts
- Type-specific controls:
- Bars: corner radius, bar width
- Lines/Areas: smooth curves, show data points, line width, step mode, area fill
- Pies: inner radius (donut hole), outer radius, rose mode, start angle
- Gauges: min/max value, pointer toggle, axis line width
- Scatter: symbol size
- Heatmaps: show/hide cell labels
- Radar: polygon or circle shape
The EChart Option JSON Editor
There is no separate JSON tab. For anything the UI controls don't cover, expand the EChart Option section at the bottom of either the Data Mapping or the Style Options tab — both of them carry it — and edit the raw ECharts option JSON directly in the code editor that opens.
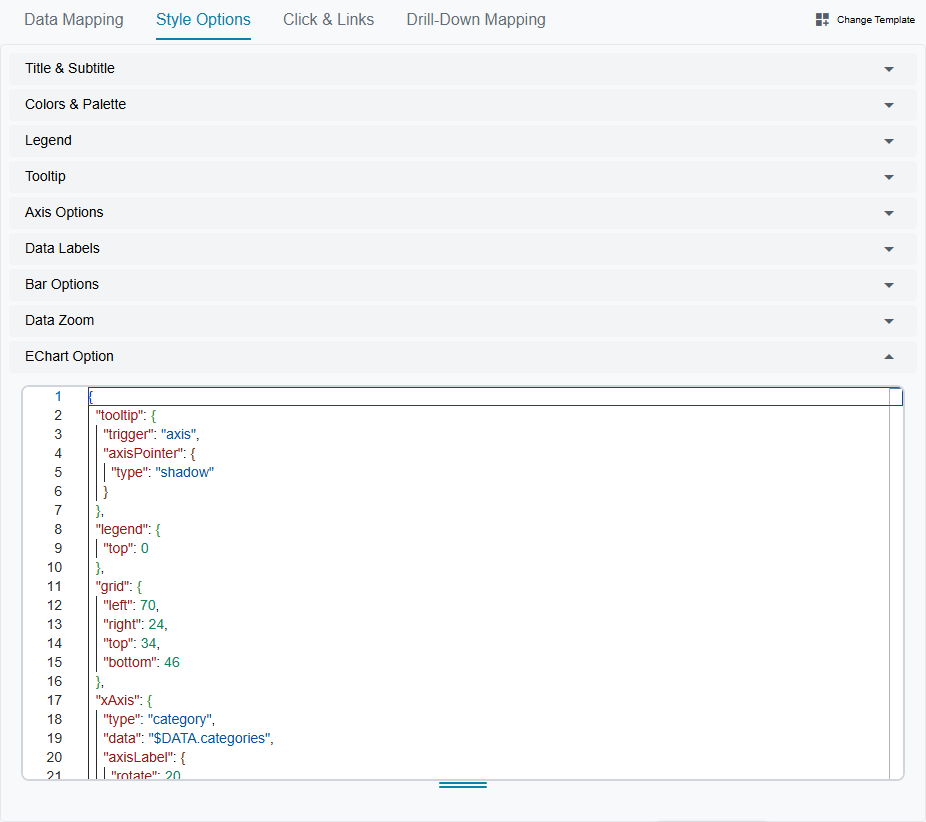
Changes in the JSON editor sync back to the UI controls, so you can mix visual editing with hand-written JSON.
TIP
You don't need to learn the full ECharts API to use the designer. The templates and UI controls cover the most common scenarios. But if you want fine-grained control — custom gradients, rich-text labels, complex tooltip formatters — the JSON editor is there. See the Apache ECharts documentation for the full option reference.
Click & Links Tab
Configure what happens when users interact with the chart — covered in detail in the Cross-Filtering and Links sections below.
Drill-Down Mapping Tab
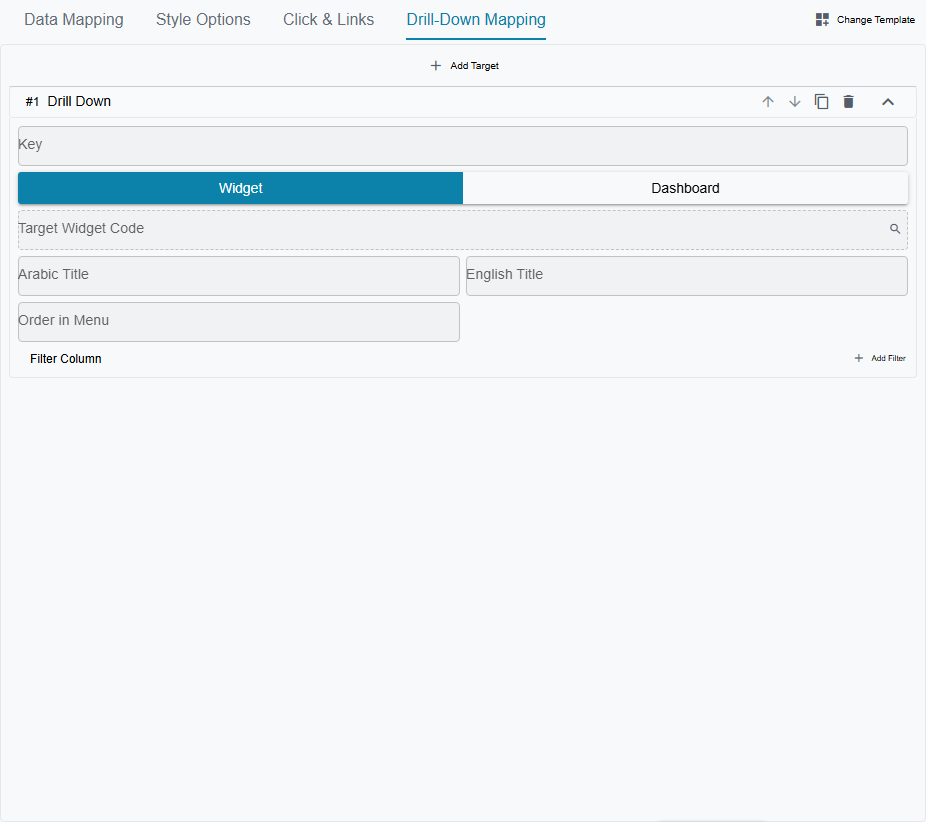
Configure drill-down targets — covered in the Drill-Down section below.
Dashboards & Layout
A dashboard is a grid that holds multiple widgets. You configure the grid size (e.g., 3 columns × 4 rows), then place each widget by specifying its row, column, width (in columns), and height (in rows).
The part that surprises people is what those rows and columns actually are. They are proportions, not fixed cells. A dashboard set to 12 rows takes the height it has on screen and divides it into twelve; a widget four rows tall gets a third of the screen. Set the same dashboard to 24 rows and that same widget is now a sixth of the screen — nothing was added, everything shrank. So when a table looks too short, the fix is to make that widget taller, never to raise the dashboard's row count.
Scrolling follows from the same arithmetic. The dashboard is one screen tall per "row count" worth of rows, so it only scrolls once the lowest widget reaches past the row count. Put another way: if your bottom widget ends on the last row, the dashboard is promising to fit on one screen, and it will keep that promise by squeezing everything — tables first — until it does. To get a scrolling report, give the widgets the heights they deserve and let them run off the bottom.
The Technical Reference works this through with formulas, a worked comparison, and the list of widget types that size themselves to their content and ignore the height you give them.
Every dashboard has a Kind:
- Single — the classic dashboard you've always known. A grid of widgets, optionally with cross-filter bindings. This is the default for new dashboards.
- Tabbed — a container that holds other dashboards as switchable tabs, instead of holding widgets directly. See Tabbed Dashboards below.
Editing the Layout
The layout editor is opened from the dashboard record: press Edit Dashboard Elements in its action bar. Every widget is then wrapped in a dashed frame carrying its name, with a remove button and drag handles along each edge, and an Add Widget button appears above the grid.
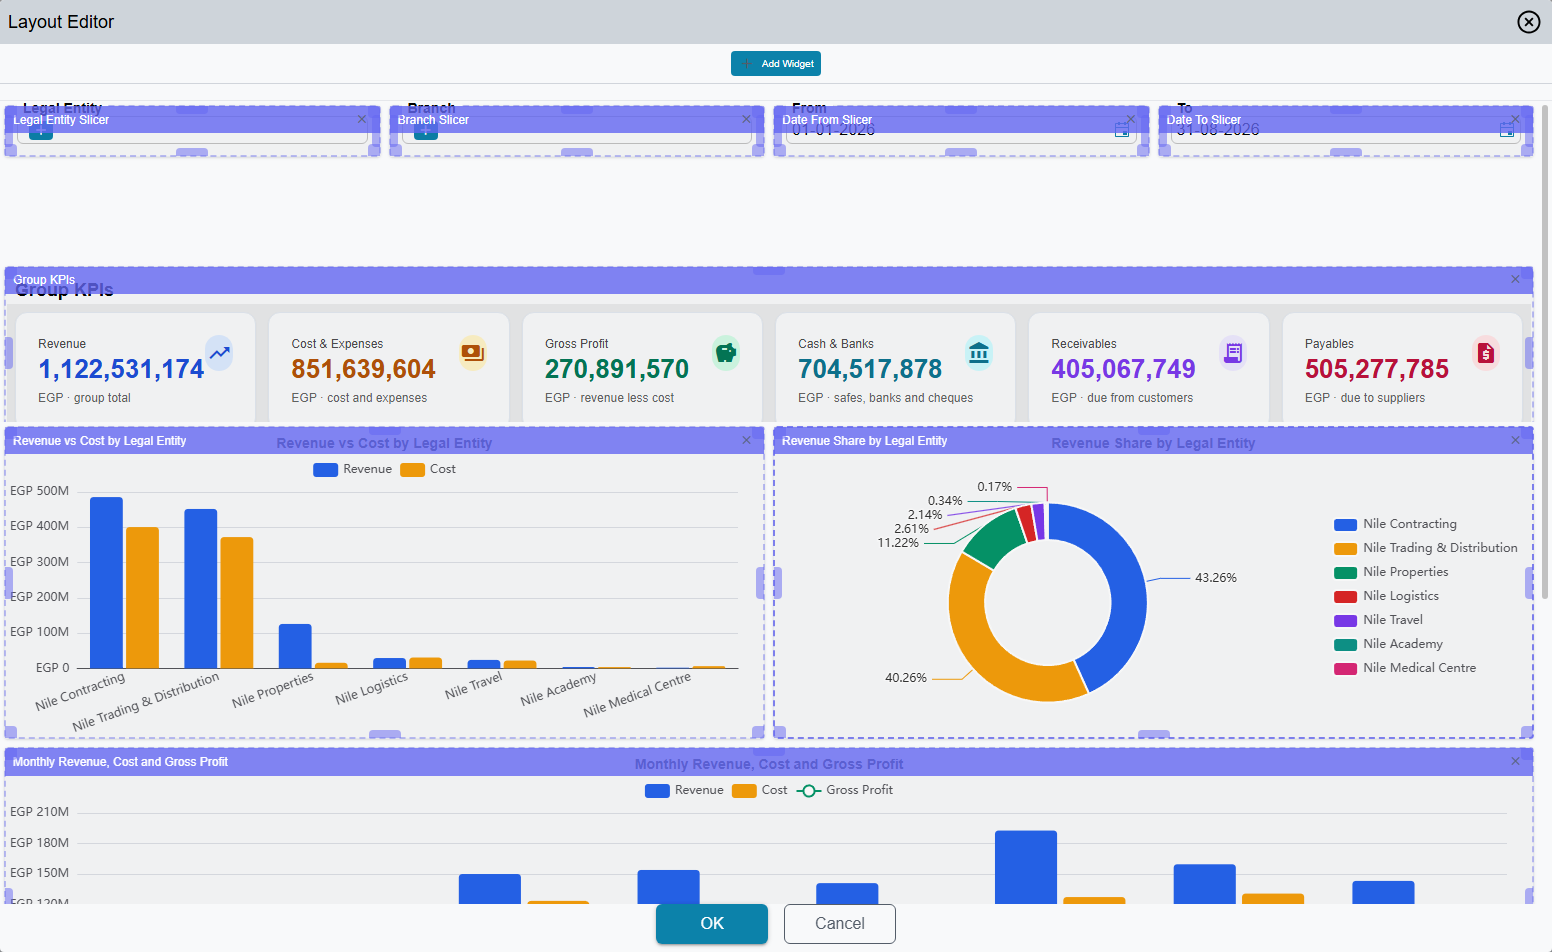
In edit mode, you can:
- Drag widgets to reposition them on the grid
- Resize widgets using handles on all edges and corners
- Save or cancel your layout changes
The layout designer is for Single dashboards only. Trying to open it on a Tabbed dashboard shows an error — Tabbed dashboards have no widget grid to lay out, just a list of sub-dashboards.
The row and column counts themselves are not edited in the designer — they are the Rows Count and Columns Count fields on the dashboard record. Change one and everything on the dashboard resizes at once, because you have changed the scale the widget heights are measured against, not the size of a cell. Two neighbouring fields on the same screen are easy to misread: Total Dashboard Rows Count is a leftover the layout editor keeps for itself and has no effect on how the dashboard displays, and Mobile Max Rows Count applies only on phones, where the grid is abandoned entirely and widgets simply stack full-width — that field decides how many of them fit on one narrow screen. Left empty, the dashboard decides for itself: two per screen, or the whole screen when there is only one widget.
Each tab of a Tabbed dashboard divides its own height by its own row count, so tabs are tuned one at a time and a change to one never affects another.
Auto-Refresh
Dashboards can refresh automatically. There are two levels:
- Dashboard-level refresh — a single timer that re-fetches all widgets at a set interval
- Widget-level refresh — individual widgets can have their own refresh interval, useful when some charts need near-real-time data and others don't
Widget Types on a Dashboard
While ECharts are the star of the show, dashboards support several other widget types:
| Widget Type | What It Does |
|---|---|
| EChart | Any of the 41 chart templates |
| Table | A data table — the SQL column names become column headers automatically |
| Table v2 (Enhanced) | A richer data table — columns are defined explicitly in JSON with formatting, cell renderers, and conditional styling. See the Enhanced Table section. |
| Metrics Cards | KPI summary cards (value + label + trend) |
| Metrics Cards v2 (Enhanced) | A richer KPI card strip — cards, slots and sparklines defined in JSON. See the Enhanced Metrics Card reference |
| Timeline | Chronological event stream. See Timeline |
| Calendar | Event calendar. See Calendar |
| Report | Embedded JasperReport. See Report |
| HTML | Custom HTML content built from the query rows. See HTML |
| Recent Visits | Shows the screens the user opens most. See Recent Visits |
| Card Menu | Navigation cards. See Card Menu |
| Resource View | Resource scheduler. See Resource View |
| CrossFilterControl | A slicer — renders one cross-filter as a picker sitting on the dashboard grid, so users set the filter without opening the Filters dialog |
| TextBlock | Static rich text — section headers, subtitles, and instructions placed between the data widgets. Its content is written once per language |
Some widget types need the new UI
EChart, Table v2 (Enhanced), Metrics Cards, Metrics Cards v2 (Enhanced), Timeline, Recent Visits, Card Menu, CrossFilterControl and TextBlock are drawn by the new UI only. Open a dashboard that contains them from the old interface and each of these widgets shows a message saying its type is supported in the new UI only, with an Open in the new UI link under it that opens the same dashboard in the new UI in a new tab.
Dashboard Groups — Putting Dashboards on the Menu
A Dash Board Group (Administration → DashBoards → Dash Board Group) is a hand-picked collection of dashboards, the dashboard twin of a report group. List its dashboards in its Details grid, or add the group to a dashboard's own Details grid (the Dash Board Group column) — the two stay in step, and deleting the group takes it off every dashboard. A dashboard can be listed only once in a group; a second line is refused with Dash Board {0} can not be repeated — «اللوحة {0} لايمكن تكرارها».
A group puts its dashboards on the menu in one of two ways (see Menu structure):
- A menu item of type Dashboards Group pointing at the group shows every dashboard in it as its own entry.
- Automatically Add To Menu on the group, together with one Auto Dash Boards item in the menu, shows every ticked group as its own sub-menu, named after the group and listing its dashboards. The Auto Dash Boards item must be the only item in its menu group. New groups then appear without editing the menu.
Which licence the BI screens need, how a user's home dashboard is chosen, and how to hide a widget or a tab from some users are on BI Menus, Licence and Access.
Tabbed Dashboards
Sometimes one dashboard isn't enough — top management wants to see warehouse, HR, and sales metrics in one place, but each team already has its own dashboard tuned for their work. Building one giant combined dashboard duplicates everything; switching between three separate dashboards is friction. Tabbed Dashboards solve this by letting you compose existing dashboards as tabs under a single parent.

The Reuse Story
Picture this:
- The warehouse team uses Warehouse Dashboard every day.
- HR has their own HR Dashboard.
- Sales runs Sales Dashboard.
Each of those is a normal Single dashboard, owned and maintained by its team. Now executives ask for one place to see everything. You create a new dashboard, set its Kind to Tabbed, and add the three existing dashboards as sub-dashboards. That's it — no duplicating widgets, no copying SQL queries, no parallel maintenance. When the warehouse team adds a new chart to their dashboard, it shows up in the executive view automatically.
The sub-dashboards are still independently navigable too — the warehouse team keeps using Warehouse Dashboard directly, with no awareness that it also lives inside an executive view.
Setting It Up
When you edit a dashboard record, you'll see the Kind field:
- Leave it as Single for a normal dashboard.
- Change it to Tabbed to compose other dashboards as tabs.
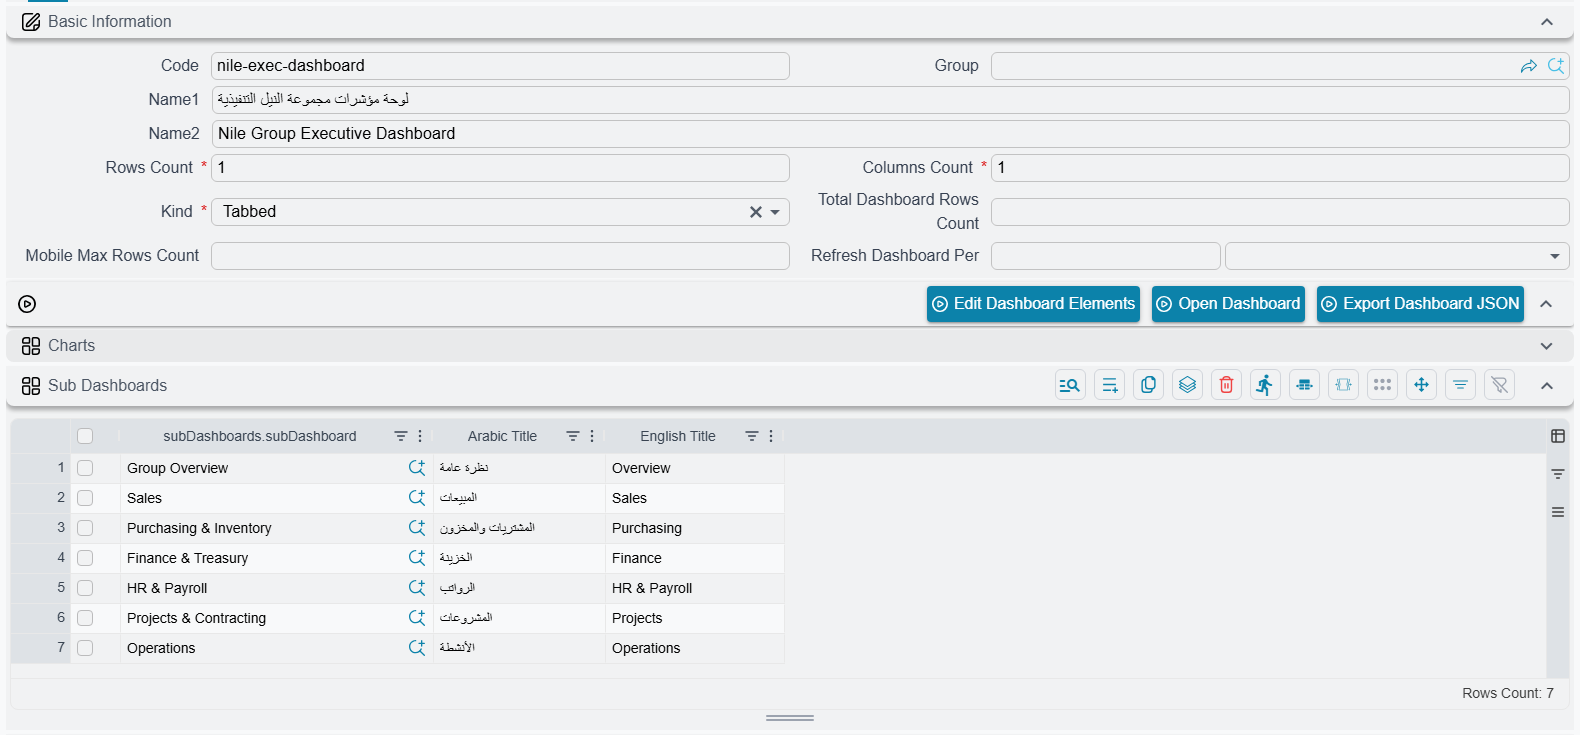
Switching to Tabbed reveals the Sub Dashboards grid. Add one row per tab:
| Field | What it does |
|---|---|
| Sub Dashboard | Reference picker pointing to an existing dashboard |
| Arabic Title | Optional override for the tab label in Arabic |
| English Title | Optional override for the tab label in English |
The order of rows in the grid is the order tabs appear in the UI. To rearrange tabs, reorder the grid rows. If you leave both title fields empty, the tab uses the sub-dashboard's own name (name1 for Arabic UI, name2 for English).
TIP
A Tabbed dashboard cannot have widgets of its own — it's purely a container. If you also try to add widgets directly, the system blocks the save. This keeps the model coherent: a Tabbed parent's job is to host sub-dashboards, nothing more.
Cross-Filters Across Tabs
The cross-filter bar at the top of a Tabbed dashboard is the union of every cross-filter defined on any of the sub-dashboards, with duplicates removed. So if Warehouse and Sales both bind a "Branch" filter, you see one Branch chip in the bar — not two.
What's more, that filter chip applies across all tabs that bind it. Click "Riyadh" while viewing the Sales tab, switch to Warehouse, and Warehouse re-fetches with the Riyadh filter applied automatically. This works because cross-filter bindings live on each sub-dashboard, and the system replays them whenever you switch tabs.
You don't define cross-filter bindings on the Tabbed parent itself — that's intentional. Sub-dashboards stay self-sufficient (so they keep working when used standalone), and the parent just unions what they declare.
Performance — Lazy Loading Per Tab
Only the active tab's widgets are fetched from the server. Switching tabs triggers a fetch for the new tab; previously-loaded tabs aren't re-fetched until you come back. This means heavy dashboards in rarely-visited tabs don't slow down the parent — you pay only for what you look at.
Cross-filter changes also re-fetch only the active tab. Other tabs pick up the filter when you visit them next.
Bookmarking & Sharing
The active tab is encoded in the URL as the sd (sub-dashboard) query parameter. So you can:
- Bookmark a specific tab + filter combination, and the link reopens in the same state
- Share a link that points colleagues directly to "the warehouse tab with the Q1 date filter pre-applied"
- Use the browser back/forward buttons — switching tabs doesn't break navigation history beyond the URL update
What's Different About Editing Tabbed Dashboards
A Tabbed dashboard has no widget grid, so:
- The layout designer doesn't open for Tabbed parents. Click "Edit Dashboard Elements" and you'll see an error message asking you to use the Sub Dashboards grid instead.
- To edit a sub-dashboard's widget layout, navigate to that sub-dashboard directly (it's still a normal Single dashboard) and use the layout designer there. Changes appear in the parent automatically.
Rules & Limits
A few invariants are enforced when you save:
- No nested tabs. A sub-dashboard cannot itself be Tabbed. Tabs are one level deep — this avoids cycles and keeps the UI predictable.
- No self-reference. A dashboard cannot list itself as one of its own tabs.
- No duplicate sub-dashboards. Each sub-dashboard can appear at most once in the tab list.
- Cross-filter bindings live on sub-dashboards only. A Tabbed parent cannot have its own bindings — the union from sub-dashboards is what powers the bar.
- Permission filtering at runtime. If you can see the parent but not a particular sub-dashboard, that tab still shows up but renders an error message instead of widgets, so you know something's restricted rather than silently hiding it.
Cross-Filtering
Cross-filtering is how charts talk to each other. When you click a bar for "Riyadh Branch" on one chart, every other chart on the dashboard re-fetches its data filtered to Riyadh Branch. Click it again and the filter clears.
Filter values are global, not per-dashboard. A filter you set on one dashboard is still set when you navigate to another one — if that dashboard binds the same cross-filter, it opens already filtered. Remove the chip from the filter bar when you want a clean slate.
How It Works
There are three pieces to a cross-filter setup:
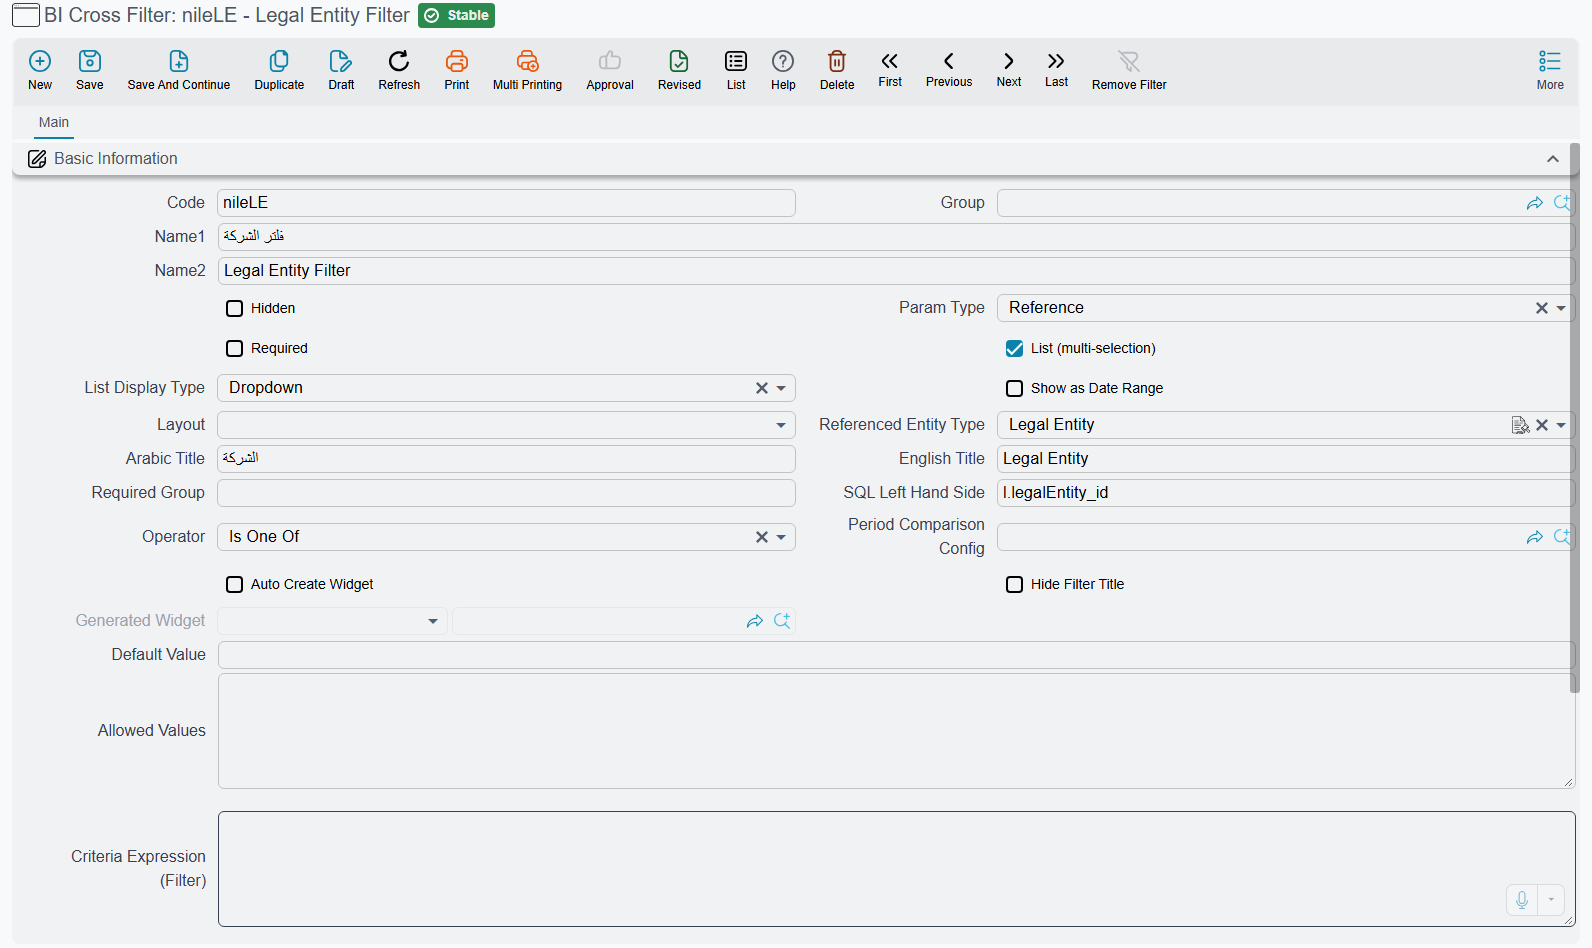
BICrossFilter entity — a reusable filter definition stored in the system. It specifies the parameter type (reference, date, text, etc.), which SQL column to filter on, and which comparison operator to use. You create these once and reuse them across many widgets.
Cross-filter bindings on widgets — each widget declares which cross-filters it responds to. When a filter is active, the widget's SQL query gets an extra WHERE clause injected automatically.
Click emit mapping on widgets — each widget can declare which cross-filters it emits when a user clicks on it. This is what makes a pie chart click set a filter that other charts react to.
A filter definition itself looks like this:
The Filter Bar
At the top of every dashboard that uses cross-filters, you'll see a filter bar. It shows:
- A Filters button with a count of active filters (e.g., "Filters: 3")
- Filter chips — one per active filter, showing the field label and selected value, with an X button to remove it
- Clicking the Filters button opens a filter editor dialog where you can set or change multiple filter values at once

And this is the dialog behind that button:
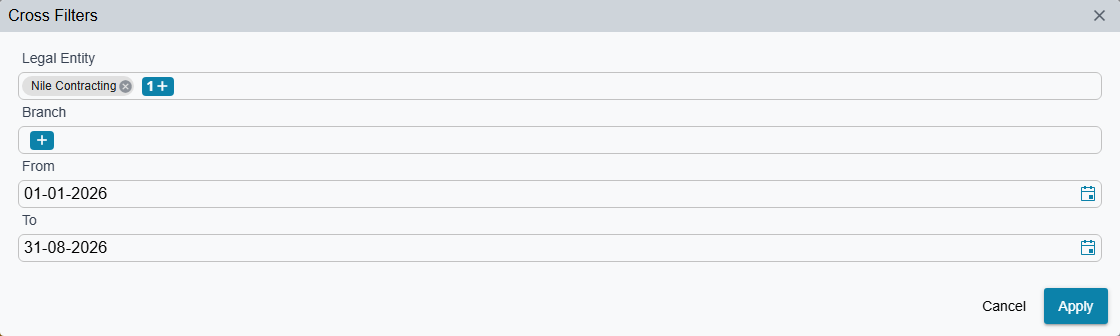
The dialog can come up empty
If the dashboard already surfaces its cross-filters as slicer widgets on the grid — the row of pickers you often see under the toolbar — those filters arrive marked as hidden from the dialog, so the dialog renders no rows at all. Nothing is broken: set the values in the slicers instead.
Filter Types
Cross-filters support all the data types you'd expect:
| Type | Example | UI Control |
|---|---|---|
| Reference | Branch, Customer, Item | Entity lookup field |
| Date | From date, To date | Date picker |
| Text | Search keyword | Text input |
| Integer / Decimal | Minimum amount | Number input |
| Enum | Invoice status | Dropdown |
| Boolean | Active only | Checkbox |
| List | Multiple branches | Multi-select |
| Date range | A whole period in one control | Range picker with ready-made periods — see Date-Range Filters below |
Date-Range Filters
Bounding a dashboard to "the first of the month through today" with two separate date filters means two records to maintain, two chips in the bar, and two chances for the pair to drift apart. Ticking Show as Date Range on a cross-filter collapses that pair into a single control that carries both ends of the period.
You set it up on the cross-filter record: tick Show as Date Range — it sits beside Parameter Type and List Display Type — and point SQL Left Hand Side at the date column you want bounded. There is no second record to create; both ends come from this one.
On the dashboard the filter renders as a button showing the chosen period. Open it and you can pick either:
- A ready-made period, offered in three groups — current (Today, This Week, This Month, This Quarter, This Year), previous (Yesterday, Previous Week, Previous Month, Previous Quarter, Previous Year) and rolling (Last 7, Last 30, Last 90, Last 365 days).
- A custom range — click the two ends on the calendar, or type them into the From and To boxes. Enter them the wrong way round and they are swapped for you.
Either way, every widget bound to that cross-filter receives two conditions instead of one: the column is compared >= the start of the period and <= its end. One filter, one control, two SQL conditions.
A ready-made period keeps moving
Picking a ready-made period stores the period itself, not the two dates it happened to resolve to today. "This Month" stays this month — open the same dashboard next month and the widgets cover the new one. A custom range is the opposite: it pins the literal dates you chose.
Two things worth knowing while configuring one:
- The comparison is always the
>=/<=pair, so there is no Operator to choose. - A Custom WHERE Clause, on the cross-filter or on a widget's binding, still wins: it replaces the generated pair with your own SQL, exactly as it does for an ordinary filter.
Operators
Each cross-filter can use a different comparison operator:
| Operator | SQL | Typical Use |
|---|---|---|
| Equal | = | Exact match (most common) |
| In | IN (...) | Multi-value selection |
| GreaterThanOrEqual | >= | "From" date, minimum value |
| LessThanOrEqual | <= | "To" date, maximum value |
| GreaterThan / LessThan | > / < | Strict comparison |
| NotEqual | <> | Exclusion |
| Contains | LIKE '%...%' | Text search |
| StartsWith | LIKE '...%' | Prefix match |
Widget-Local Filters
Sometimes one chart needs a slicer of its own that the rest of the dashboard must not feel — "show this KPI for the northern region" while every neighbouring widget stays on the group total. That is what the Widget-Local Scope tick on a cross-filter binding is for.
Tick it on the binding row — in the widget's cross-filter bindings grid, or on a dashboard-level override row — and the filter moves out of the dashboard filter bar and into the widget itself. A filter button appears in the widget's top-right corner, carrying a badge with the count of its active local filters; clicking it opens a small dialog with one input per local binding, an Apply button and a Clear All.
Local filters are deliberately sealed off from the dashboard conversation:
- A value clicked on a neighbouring chart, or typed into the dashboard filter bar, never reaches a local binding — only the widget's own popup drives it.
- If every binding of a given cross-filter across the whole dashboard is local, that filter disappears from the dashboard filter bar altogether.
- Drill-down is the exception, because it is an explicit user action: a drill-down that targets a locally-bound filter still passes its value through.
Local values travel in the dashboard URL alongside the global ones, so a link you copy reopens with the same per-widget state.
Visual Feedback
When cross-filters are active, widgets show badges indicating:
- "Filtered by: Branch, Date" — this widget's data is filtered by these cross-filters
- "Emitting: Branch" — this widget is the source of the active Branch filter
The widget that emitted the filter is also framed more heavily than the widgets that merely react to it:
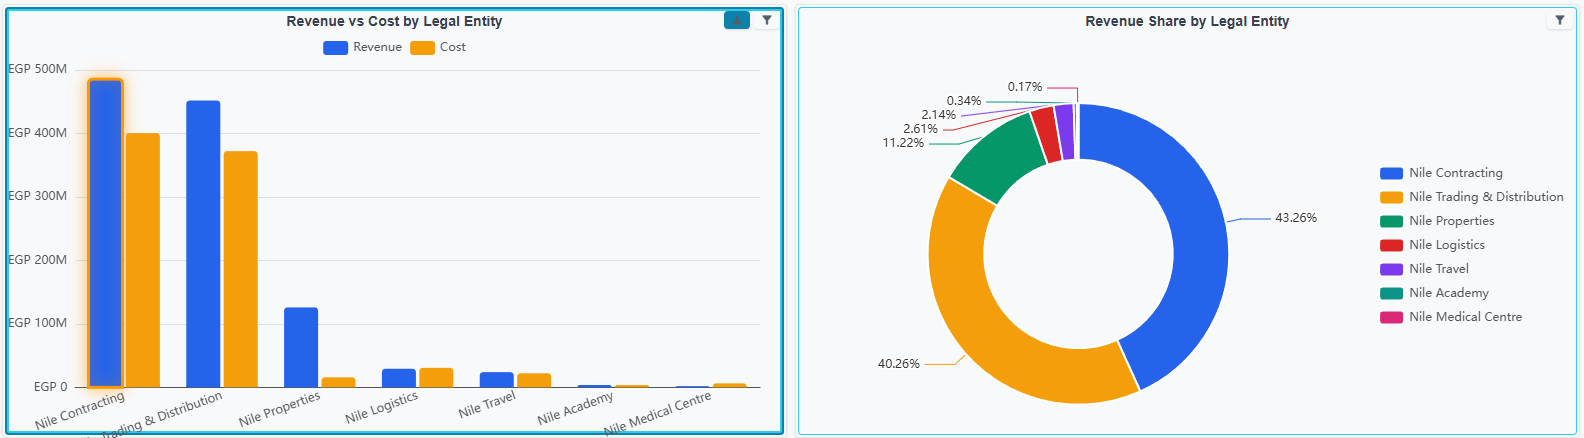
Hover over a badge to see the actual filter values.
Drill-Down
Drill-down lets users navigate from summary data to detail data. Right-click a data point and a context menu shows you where you can drill into. There are three flavors:
Widget Drill-Down (Chart → Chart)
Right-click a data point → select a target → a popup opens showing the target widget's chart, pre-filtered to the clicked value. For example, right-click "Electronics" on a sales-by-category pie → drill into "Top 10 Items in Electronics" bar chart.
You can configure multiple drill-down targets per widget, and they appear as separate items in the right-click menu.
Dashboard Drill-Down (Chart → Dashboard)
Same idea, but the target is an entire dashboard instead of a single widget. The drill-down filters are passed to all widgets on the target dashboard. Great for hierarchical analysis — e.g., company overview → regional dashboard → branch dashboard.
Dimension Drill-By (Same Chart, Deeper Dimension)
If a widget uses a wizard data source with multiple dimension fields, you can drill down by dimension. Right-click "Riyadh" → Drill down by… → Month → see the same metric broken down by month for Riyadh only. A breadcrumb trail tracks your path (Region → Branch → Month), and you can click any breadcrumb to go back.
Drill down by… appears only for wizard-backed widgets. A widget whose data comes from a raw SQL query never offers it, however many columns that query returns, because the system needs the wizard's field structure to rebuild the query on the fly.
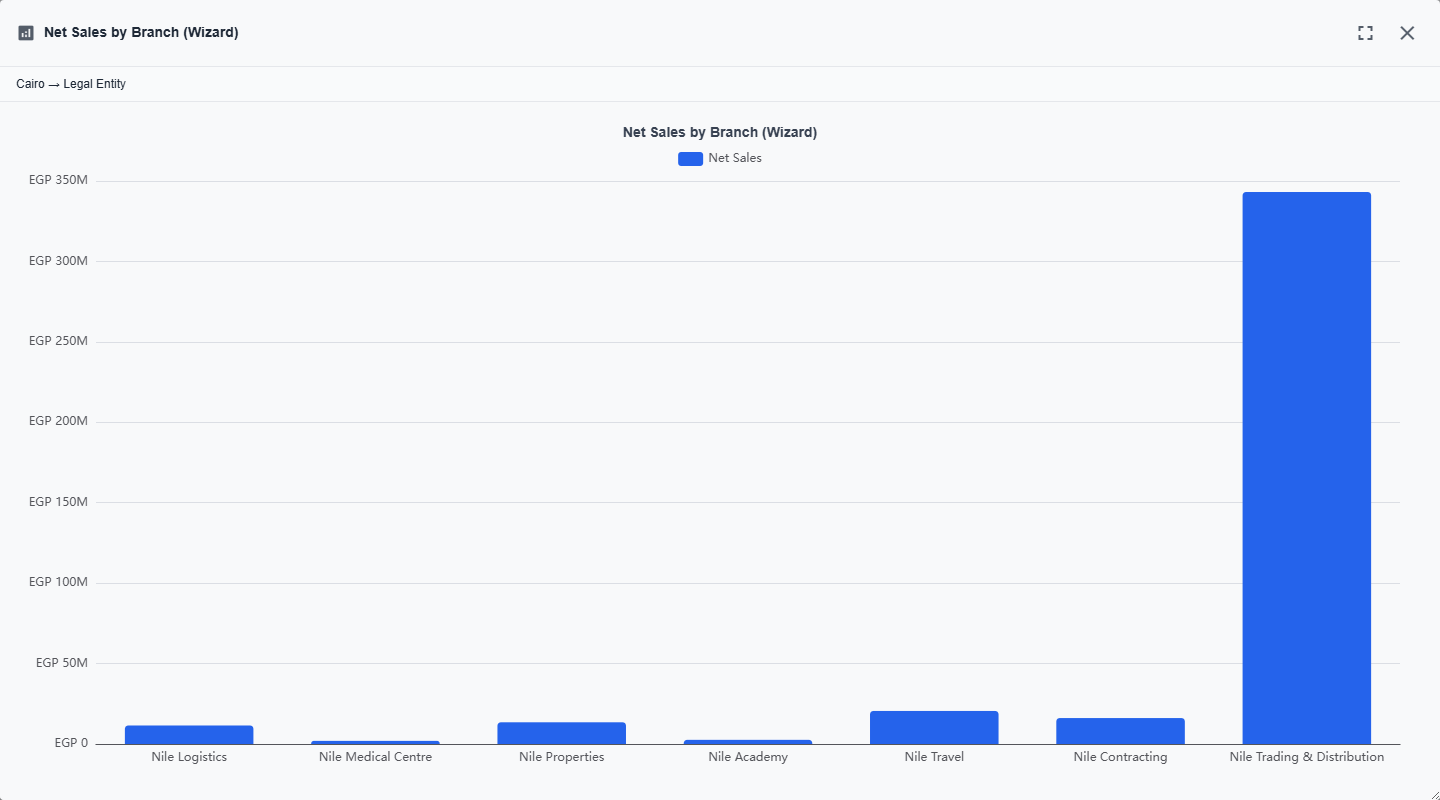
How drill-by works for multi-dimension charts (CategoryLabelValue, stacked bars, etc.):
- The drilled dimension replaces the category (X-axis). If the chart also has a label dimension (series breakdown), that label stays put — the chart keeps the same visual shape with the new X-axis.
- The filter stack only accumulates the clicked category value, not the label value. So right-clicking a "January / Product A" bar and drilling by Region gives you January's regional breakdown across all products — not just Product A's.
- The right-click menu hides dimensions that are already active on the chart, so you can't drill by a dimension the chart is already grouping by.
Cross-filter emission is a separate flow: left-clicking a data point emits filters for every active dimension of that point (category + label together), independent of drill-by.
Single-Click Drill-Down
By default, drill-down requires a right-click. But you can configure a widget so that a left-click immediately triggers a specific drill-down target — no menu needed. This is configured via the clickAction setting in the Click & Links tab.
The Drill-Down Dialog
When a drill-down opens in popup mode (the default), it shows:
- A breadcrumb trail at the top showing the path you've taken (clickable to go back)
- The target chart rendered with the drill-down filters applied
- A maximize button for full-screen viewing
- Support for nested drill-downs — you can drill from the popup into another popup
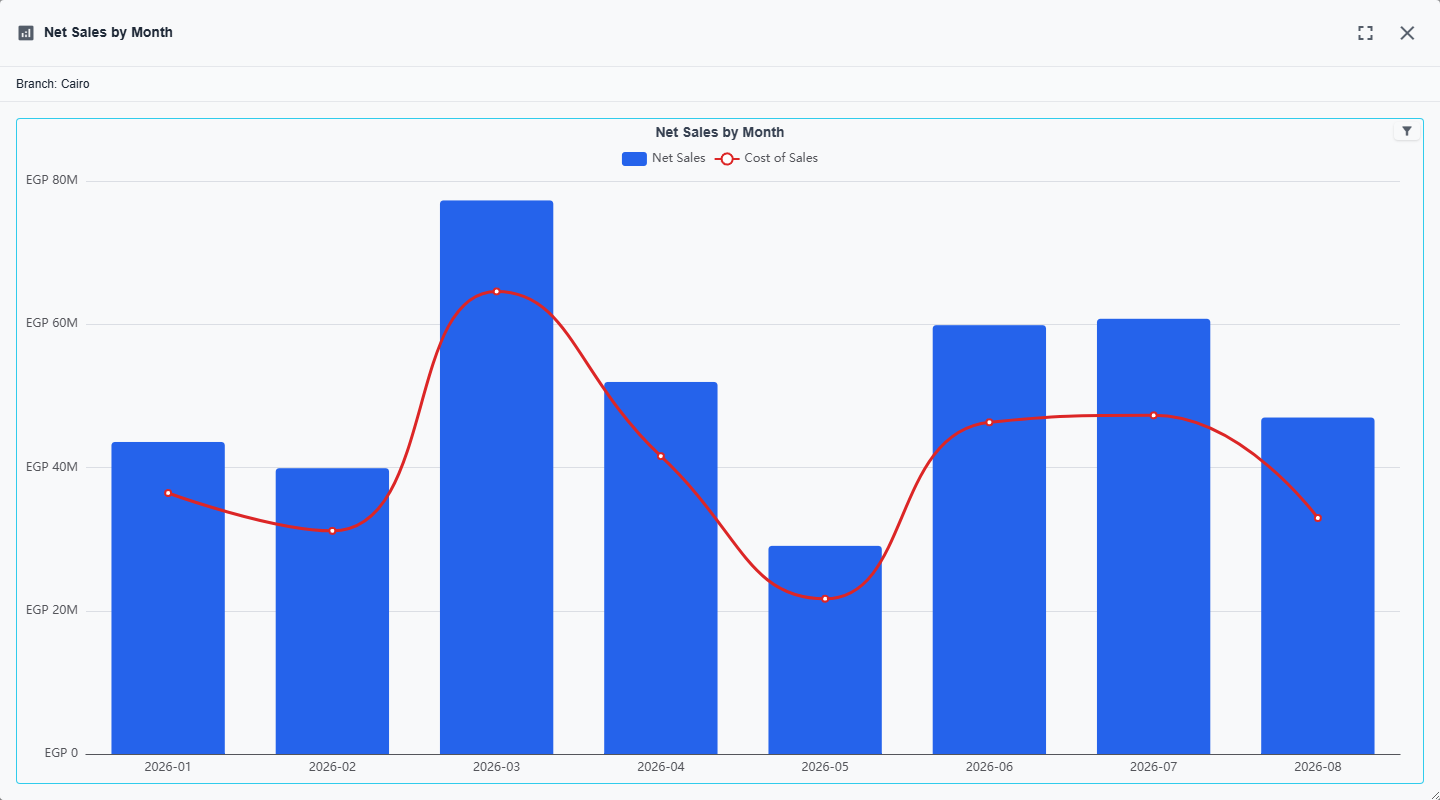
Links — Navigate to Records
Sometimes you want to click a chart data point and jump to the actual ERP record behind it. That's what link mappings are for.
Entity Links
Point a link at an entity type + ID column, and clicking opens that record's edit screen. For example, clicking a bar for "ABC Trading" can open the Customer record for ABC Trading — in a popup dialog, the same tab, or a new tab.
A nice touch: you can configure a labelColumn so the context menu says "Open Customer 'ABC Trading'" instead of just "Open Customer".
URL Links
If your SQL query returns a URL column, you can link to it directly. Absolute URLs (http/https) open in a new tab; relative URLs navigate within the app.
Where Links Appear
Links show up in the right-click context menu under a "Navigate To" section. Like drill-down, you can also configure a link as the default left-click action.
The Right-Click Context Menu
When you right-click a data point on a chart that has interactions configured, you see a structured menu. It is headed by the point you clicked, and groups underneath it everything you can do with that point.
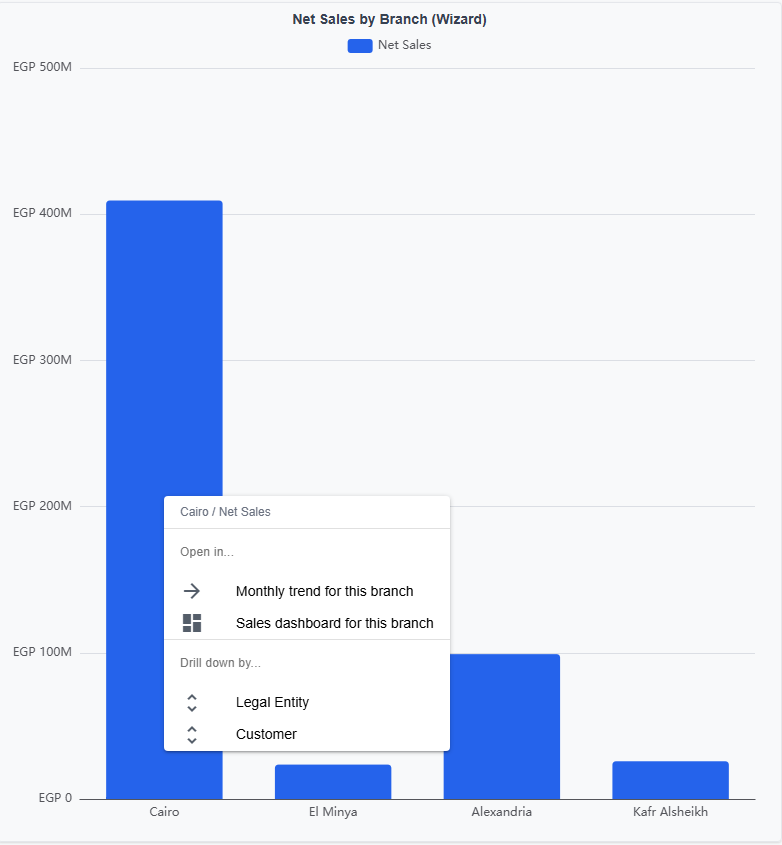
The sections are:
- Navigate To — the entity and URL links defined on the chart
- Open in… — the drill-down targets (widgets or dashboards) configured on the chart
- Drill down by… — the dimensions you can re-group this same chart by
Each section only appears if the corresponding mapping is defined, and Drill down by… additionally requires the widget to be backed by a wizard data source. A chart with no links, no drill-down targets, and no wizard dimensions shows no context menu at all.
The Chart Toolbox
Every chart can carry a small row of icons in its top-right corner, but they are hidden by default. Turn them on from the dashboard toolbar: View Options (the ⋮ button) → Show Toolbox. The choice is remembered in your browser and applies to every dashboard you open.
With the toolbox on, a chart offers:
- Collapse — folds the widget down to a title bar; click the bar to bring it back. Collapsed widgets are remembered per dashboard, so a dashboard reopens the way you left it.
- Save as Image — downloads the chart as a PNG file.
- Data View — shows the rows behind the chart as a read-only table, which is the quickest way to read exact numbers off a picture.
- Line / Bar / Stack — on charts drawn against an X and Y axis, switches the rendering on the spot, with Restore to put it back. Stack appears only when the chart has more than one series.
- Runtime Slot Selection — on wizard-backed widgets, opens the picker that lets a reader swap the dimension or measure the chart is drawn from, for this session only. See the Wizard Mode reference.
Administrators see three more: Open Widget, which opens the widget's own record, plus Copy EChart Option and Copy Server Response, which put the chart's option JSON and the server's raw answer on the clipboard — the two things worth having in hand when a chart renders differently than you expected.
Non-chart widgets — tables and cards — get a collapse button in the same corner while the toolbox is on. Slicer widgets don't collapse.
Chart Interactions Summary
| Action | What Happens |
|---|---|
| Left-click data point | Emits cross-filter (default), or navigates/drills if clickAction is configured |
| Left-click same point again | Clears the cross-filter (toggle behavior) |
| Right-click data point | Opens context menu with drill-down targets, links, and drill-by options |
| Hover data point | Shows tooltip (axis mode shows all series, item mode shows single point) |
| Scroll wheel | Zooms in/out if data zoom is enabled |
| Drag zoom slider | Adjusts visible data range |
| Toolbox: Save as Image | Downloads the chart as a PNG file |
| Toolbox: Data View | Opens the chart's rows as a read-only table |
| Toolbox: Copy EChart Option | Copies the chart's option JSON to the clipboard (administrators) |
Table Widgets
Not everything needs to be a chart. Table widgets display query results in an grid with sortable, resizable columns. The SQL column names become the grid headers — no extra configuration needed beyond the query and cross-filter bindings.
Table widgets respect cross-filters just like chart widgets do, so when you click a branch on a bar chart, the table next to it filters to show only that branch's records.
The export icon in a table's header downloads the grid as an Excel file. The file is named after the widget's English title (or its Arabic title when there is no English one) followed by the date and time of the export, for example Sales by Branch.20261005.1112.xlsx. When a table shows HTML in its cells, Excel gets the text a user actually sees in the cell — the markup, hidden elements and styling are left out, and line breaks are kept. The column filter matches on the same visible text. This applies to both the classic Table and the Enhanced Table.
Enhanced Table Widget
The classic Table widget is quick to set up but shows columns exactly as the SQL returns them — raw numbers, no formatting, no color coding, no fancy cell renderers. The Enhanced Table widget (Table v2 (Enhanced) in the widget type picker, Arabic: "جدول محسن") is a second-generation table where every column is configured explicitly, so you get per-column formatting, colored badges, progress bars, inline sparklines, and rule-based conditional styling — all without touching any custom code.
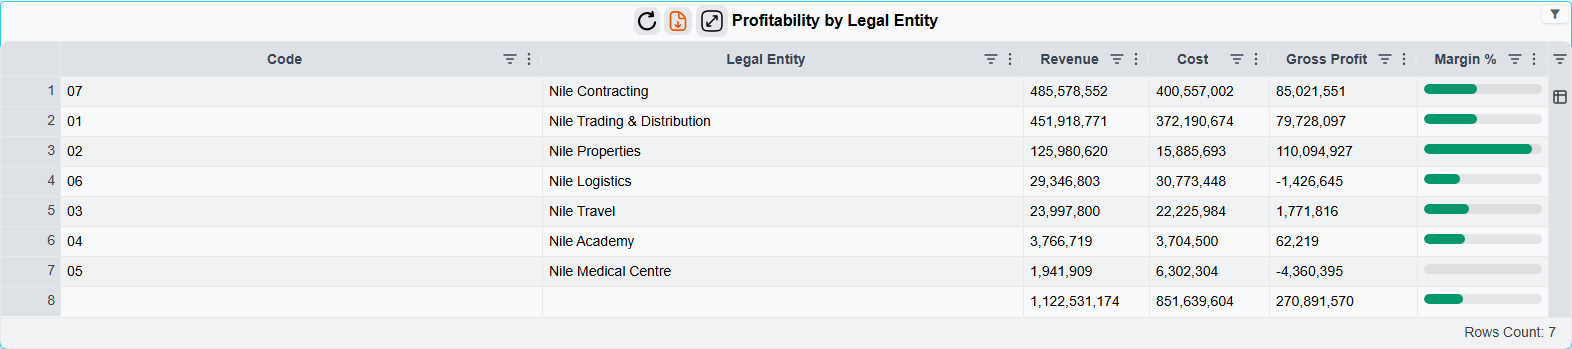
TIP
Enhanced Table is an opt-in upgrade. The classic Table widget continues to work exactly as before. Pick Enhanced Table when you need one or more of: currency/percent/date formatting, green-for-positive / red-for-negative coloring, status badges, in-row progress bars, sparklines, grouped column headers, or column pinning.
What It Can Do
Every column is configured on its own, so one table can mix:
- Formatting — number, currency (symbol before or after), percent, date, date-time and duration, with your own decimals and separators.
- Cell renderers — plain text, HTML coming from the query, coloured badges, bars and progress bars, inline sparklines, and icons picked by the value.
- Conditional formatting — colour, bold or italic a cell by threshold, range, comparison with another column, a list of values, or an empty value. The rules run on the server, so numbers compare as numbers and dates as dates.
- Row styling — the same rules applied to the whole row, for example every row with a negative margin.
- Column groups, pinned columns, widths, row grouping and totals, and a pivot (cross-tab) layout.
- The usual interactions — cross-filters, drill-downs and record links work as on any widget, and each one can be limited to clicks on a single column.
The exact settings for each of these are in the Enhanced Table reference.
Large Tables — Paging From the Server
Normally an Enhanced Table sends all of its rows to the browser when the dashboard opens. For a table of a few hundred rows that is the fastest option, but a table with tens of thousands of rows makes the dashboard slow to open and heavy to scroll.
For those tables, open Table Options and set Row Loading to Load page by page from the server, then pick a Page Size (server paging) (100 by default). The query still runs once, as before; the difference is that the server keeps the result and the browser receives one page at a time. Sorting and column filters are applied by the server to the full result, so a filter on page 1 still finds a matching row that was on page 300, and Export to Excel exports every row that matches the current filters — not just the page on screen.
Server paging only works on a plain list. If the table has a pivot layout, a grand-total or subtotal row, row grouping, or any column with an aggregation, the widget quietly keeps loading all rows at once — the designer says so under the Row Loading box. In server mode users can't drag columns into groups or pivot, but clicks, cross-filters, drill-downs and record links all work as usual. If the table sits unused for 15 minutes, the next page request makes it re-run its query and reload by itself.
The Enhanced Table reference §2.1 has the exact rules and settings.
Admin Conveniences
When logged in as admin (or any user with treatAsAdmin enabled), the widget toolbar shows two extra buttons:
- Copy Data JSON — copies the widget's fully-computed data payload to the clipboard. Handy for debugging formatting rules or understanding why a particular cell looks the way it does.
- Open Widget — opens the widget's edit screen in a new tab. This same button also appears on
Table,Metrics Cards,Card Menu, andEChartwidgets for admins, giving one-click access to widget configuration from any dashboard.
Designer
The chart-config editor for Enhanced Table widgets swaps the ECharts Data Mapping tab for a Table Columns tab.
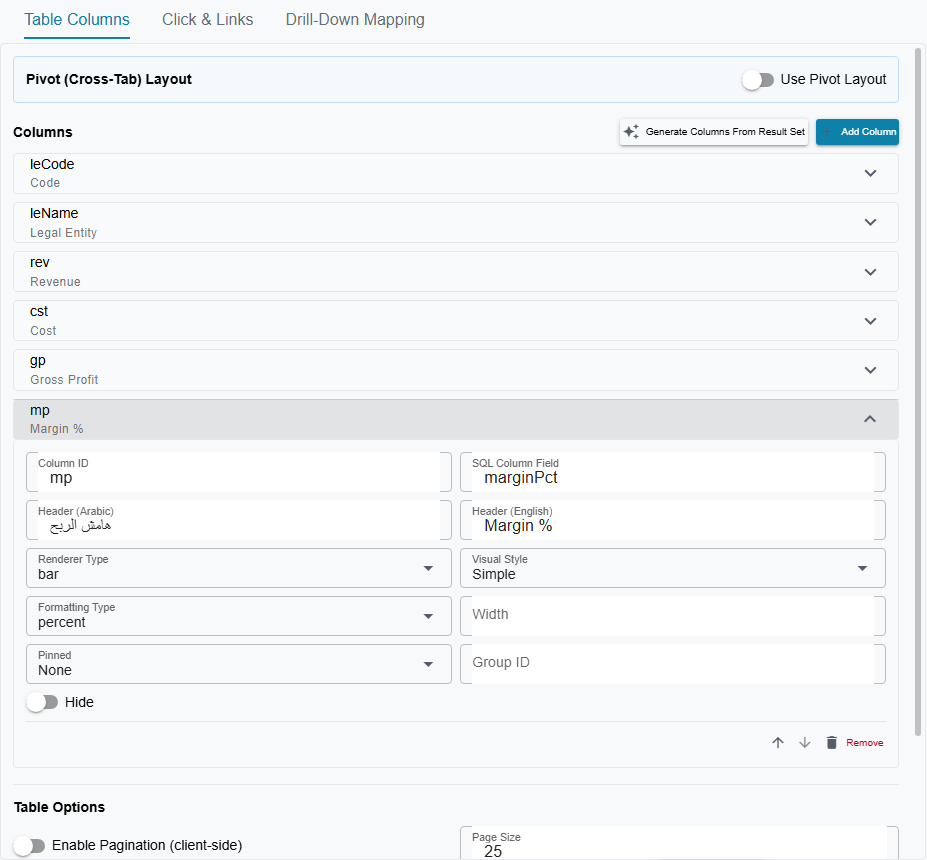
From that tab you can:
- List and reorder columns (drag-and-drop arrow buttons)
- Edit each column's id, field, headers, width, pinning, renderer type, formatting type inline
- Bootstrap from a SQL query via the Generate Columns From Result Set button — this runs the data-source SQL and seeds one default column per result-set header, so you're not starting from zero
A companion Table Options tab covers the grid-level switches (pagination, row grouping, grand total row, row loading, etc.).
For more advanced configuration — specifically column groups, per-renderer options like bar min/max or icon mappings, and the full conditional-formatting rule DSL — use the Raw JSON tab. The Enhanced Table reference has the complete schema.
When To Use Which
| Use Case | Widget |
|---|---|
| Quick ad-hoc grid over a SQL query, no styling needed | Table |
| Financial tables with currency formatting, negative-in-red, totals | Table v2 (Enhanced) |
| Status / priority / category columns that should read as colored badges | Table v2 (Enhanced) |
| KPI-style tables with inline bars or sparklines showing relative magnitude | Table v2 (Enhanced) |
| Tables with column groups, pinned columns, or per-column aggregation presets | Table v2 (Enhanced) |
Upgrading An Existing Table
No automatic migration — switching is a deliberate choice per widget:
- Edit the
DashBoardWidgetrecord and change its type fromTabletoTable v2 (Enhanced). - Open the chart-config editor. The Table Columns tab appears in place of the ECharts data-mapping tab.
- Click Generate Columns From Result Set to seed columns from the widget's SQL.
- Tweak formatting, renderers, and conditional formatting as you want.
- Save. Any existing cross-filter, drill-down, and link mappings continue to work — the
columnfield on those mappings already matches the default columnids (which are just the SQL column names).
Data Sources
Each widget gets its data from either a raw SQL query or a wizard data source.
Raw SQL
You write a standard T-SQL SELECT query. The only requirement is including the /*AND-FILTERS*/ placeholder in the WHERE clause — this is where the system injects cross-filter conditions at runtime. Because it's a SQL comment, your query remains valid if you paste it into SQL Server Management Studio for testing.
Wizard Data Source
Instead of writing SQL, you define a data source using Nama ERP field IDs (property paths like customer.customerCategory or price.netValue). The system generates the SQL automatically. Wizard fields are marked as either Dimension (group-by / category) or Measure (aggregated value with Sum, Count, Average, Min, or Max).
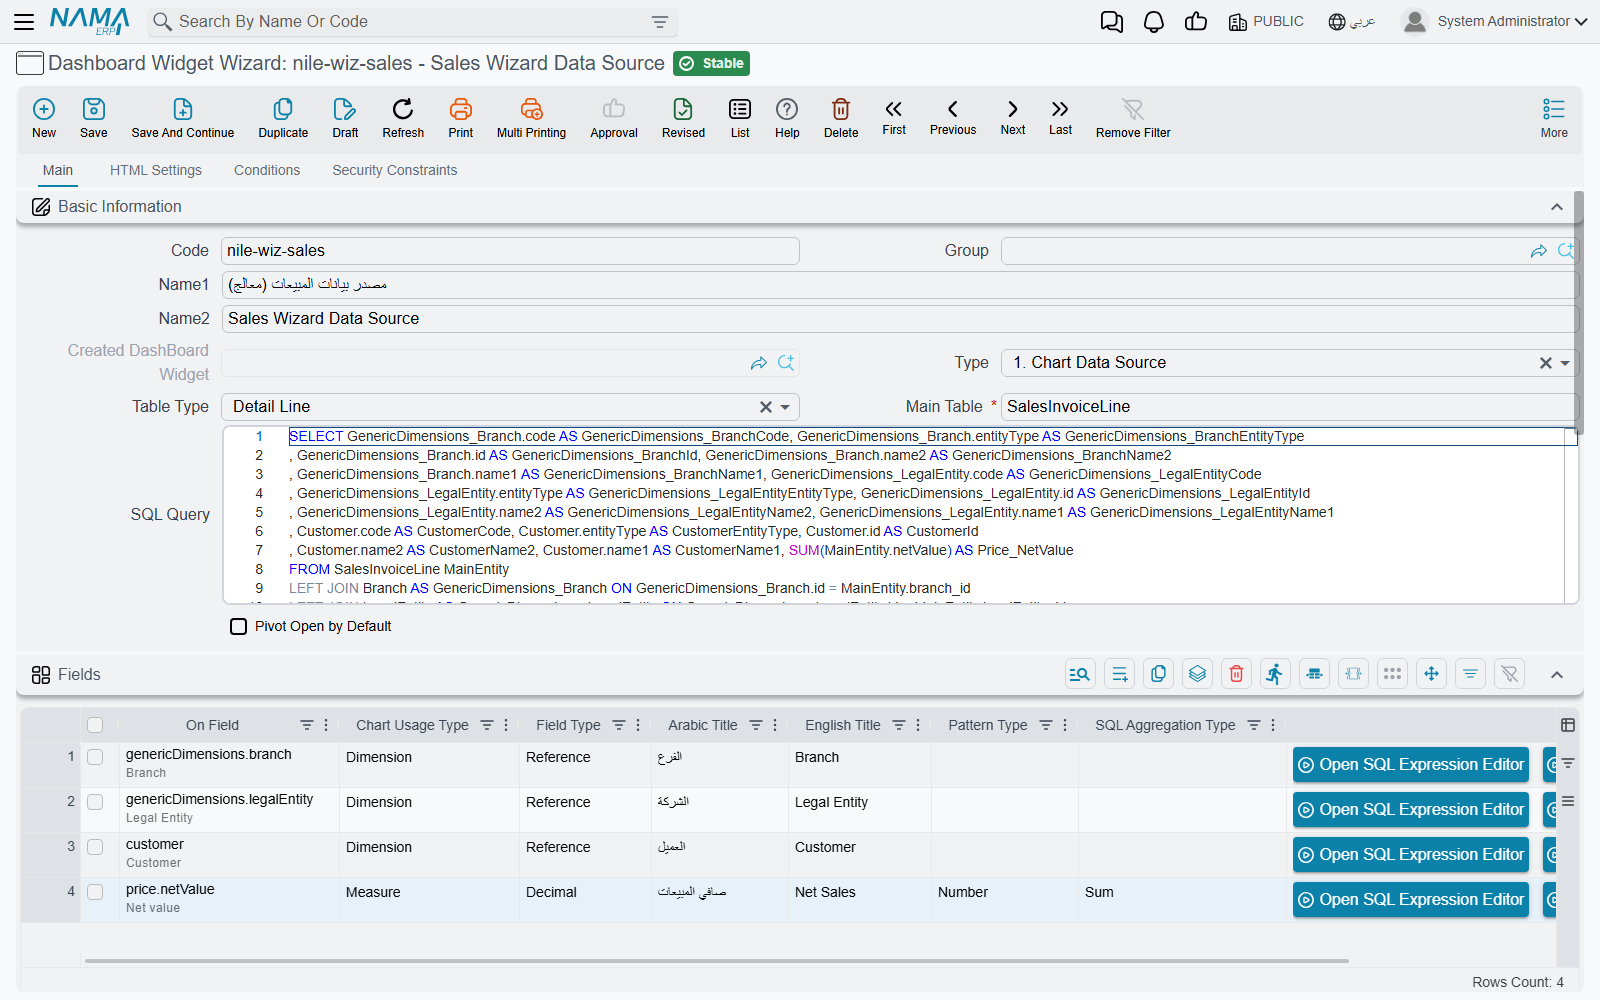
Wizard data sources unlock several designer and runtime conveniences that raw-SQL widgets don't get:
- Dimension drill-by — right-click a data point and drill by any other dimension defined on the wizard. Only available for wizard-backed widgets because the system needs the field structure to rebuild the query on the fly.
- Auto-inferred cross-filter columns — when you emit a cross-filter from a reference field (like
customer.customerCategory), you don't write out the id / code / name1 / name2 / entityType columns. The system reads them from the wizard field's metadata, which is cached when you save the wizard. - Per-dimension click and drill mappings — if a chart has multiple dimensions (e.g., category and label on a stacked bar), each dimension gets its own set of click-emit and drill-down entries. The chart designer exposes an "Active Dimension" selector in the Click & Links and Drill-Down tabs to switch between them.
- Field-ID pickers instead of column-name pickers — the designer's data-mapping, cross-filter, and drill-down pickers list wizard field IDs (with translated titles and the raw ID shown for disambiguation) instead of raw SQL column names.
Whenever you save a wizard, the system pre-computes a metadata record for each field (display alias, SQL LHS, referenced entity type, sub-column aliases for references) and caches it on the field line. Chart rendering reads from this cache, so wizard-mode widgets don't pay a query-rebuild cost on every request just to look up aliases.
Number Formatting
You can specify how numeric values are displayed in tooltips, axis labels, and data labels. Format options include:
| Format Type | Example Output |
|---|---|
number | 1,234,567.89 |
currency | SAR 1,234,568 |
percent | 85.5% |
compact | 1.2M, 45K |
You can also control decimal places and specify a currency symbol. If you set the type to currency without specifying which currency, the system uses your organization's default.
Period Comparison
Sometimes you need to answer "how does this quarter compare to the same quarter last year?" without building a completely different dashboard. The period comparison feature handles this — the system runs your existing widget query twice (once for the current dates, once for the shifted dates) and merges the results, so every chart that opts in automatically shows both periods side by side.
Setting It Up
Three pieces are needed:
Create a
BI Period Comparison Config— a master file that defines:- How far to shift the dates (e.g., 1 Year, 3 Months) using the
Subtracted Periodfield - Column names for the injected period columns (e.g.,
periodAr/periodEn) - Display labels for each period (e.g., "Current Year" / "Previous Year" in both Arabic and English)
- How far to shift the dates (e.g., 1 Year, 3 Months) using the
Link it to your date cross-filters — on each date cross-filter (e.g., Date From, Date To), set the
Period Comparison Configfield to the config you created. Both date filters should point to the same config so both ends of the range shift together. If you use a single date-range filter instead of a From/To pair, set the config on that one record — both ends of its period shift together.Enable comparison on each widget — on the widget, check the
Enable Comparisoncheckbox. Only widgets with this flag enabled will run the double-query comparison. Other widgets on the same dashboard continue to work normally with a single query.
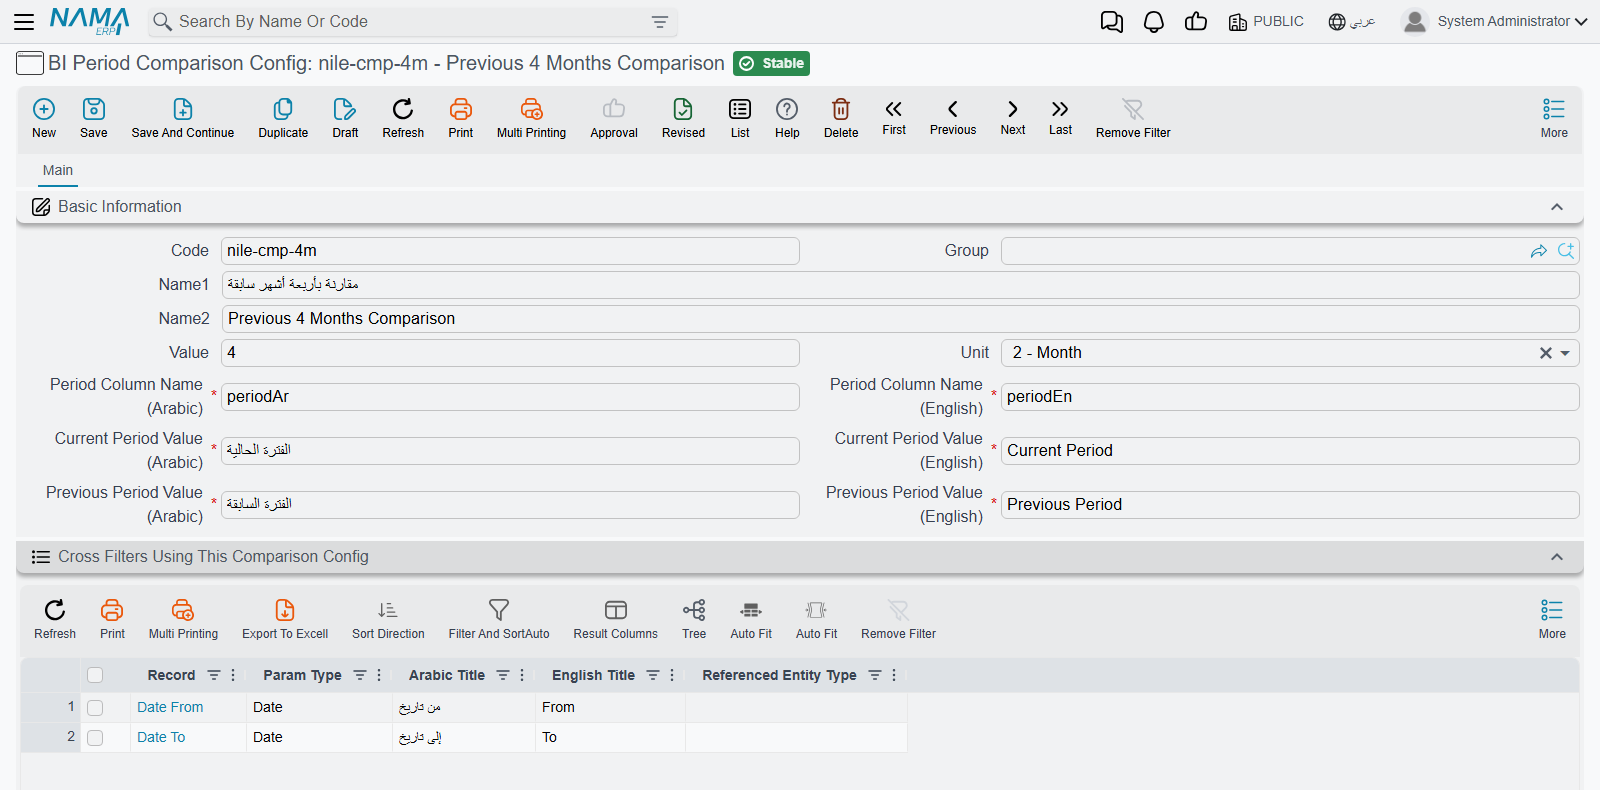
Two Modes of Comparison
Mode A — Period Label Column (for trend charts)
Best for line charts, area charts, and any chart that uses CategoryLabelValue data mapping. The system injects a period column into the result set (using the column names from your config), and the chart's labelColumn can reference it to automatically get two series — one per period.
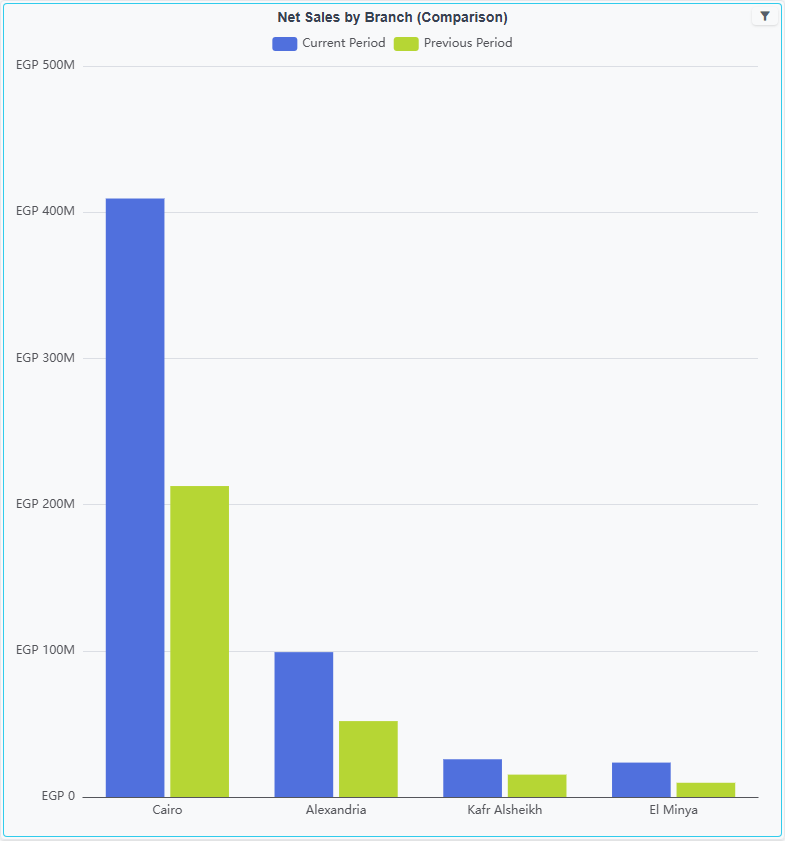
Example: A monthly sales trend line chart with categoryColumn: "monthLabel" and labelColumn: "periodEn". When the user selects January–March 2026, the chart shows two lines: "Current Year" and "Previous Year", both plotted against months 01, 02, 03.
For this mode, format your month/category to exclude the year (e.g., FORMAT(l.valueDate, 'MM') instead of 'yyyy-MM') so that the same months align across periods.
Mode B — Column Split (for bar charts and explicit series)
Best for bar charts, ranked lists, and any chart that uses CategoryValue with explicitly defined series. Instead of adding a period dimension, this mode splits a measure column into two: one for the current period, one for the previous period.
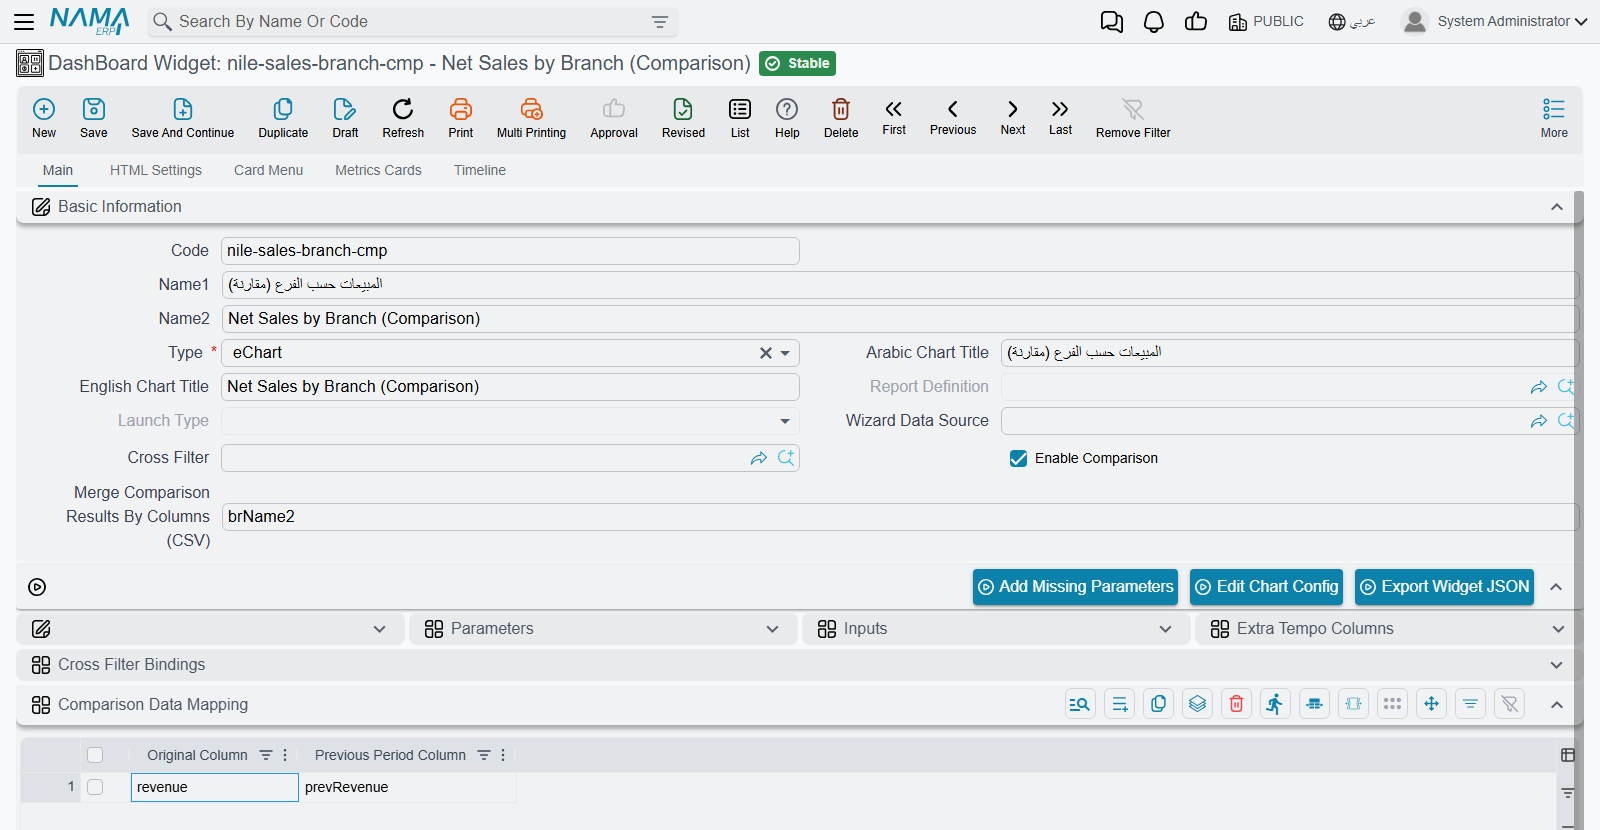
Configure it in the widget's Comparison Data Mapping grid:
| Original Column | Previous Period Column |
|---|---|
netValue | prevNetValue |
Your chart's CategoryValue data mapping then has two series: one for netValue ("Current Year") and one for prevNetValue ("Previous Year"), producing side-by-side bars.
For EChart widgets, you don't need to set Merge Comparison Results By Columns — the ECharts data mapping layer already merges rows that share the same category/label keys and sums their values automatically. However, Merge Comparison Results By Columns is important for non-chart widget types like Tables, Metrics Cards, and other widgets where there's no data mapping layer to handle the merge. Set it to a CSV of the columns that identify a unique row (e.g., itemClassName), and the system will match rows from both periods and combine them into a single row instead of appending duplicates.
Query Parameters
Regardless of mode, the system injects two parameters into every comparison query: periodArValue and periodEnValue. Widget authors can use these directly in SQL — for example, in CONCAT() or CASE expressions — to label or transform data based on which period is currently being queried.
Creating Dashboards with AI
The BI Module Technical Reference documents every JSON structure, SQL pattern, and import format you need to create dashboards programmatically. It's written specifically for AI tools and developers — which means you can use an AI assistant to design and generate complete dashboard import files for you.
Using AI to Build Dashboards
Here's a workflow that works well:
Give the AI tool the technical reference link:
https://docs.namasoft.com/platform/bi/bi-module-technical-reference.htmlTell it what data model you're working with — you can point it to dm.namasoft.com for schema discovery
Describe the dashboard you want in plain language, for example:
"I need a sales analysis dashboard with a pie chart showing sales by customer category, a horizontal bar chart showing top 10 items, a monthly trend line chart, and a details table. All charts should be cross-filtered by branch, date range, and customer category. The pie chart should emit the customer category filter when clicked, and the bar chart should drill down to invoice details."
Ask the AI to generate a complete import JSON file following the technical reference format
Import the generated JSON into Nama ERP with More → Import Records (see How to Import) — you'll have a working dashboard with all the cross-filters, drill-downs, and styling ready to go
Given AI can guess table names, column names, or joins incorrectly, it is better to give it a sample query containing the columns and joins you want to use.
For wizards, you can skip the sample query and instead let the AI reference dm.namasoft.com for property paths — the wizard resolves joins automatically from the field IDs.
This is dramatically faster than building each widget by hand, especially for dashboards with many interconnected charts and complex cross-filter setups.
Letting the AI Check Its Own Work
An assistant that writes a widget without seeing it run is guessing: it cannot tell that its query returns no rows, that a join counts every invoice twice, or that a cross filter never reaches the query. Connect it to the system over MCP and give it the dashboard tools — the Add Report Tools button on the AI Tool Definition screen adds them — and it can close that loop itself:
- Run a dashboard and read what every chart, table and card shows, as numbers rather than a picture, with the cross filters you choose.
- Run one widget and read the SQL it actually executed — with the cross filter conditions written into the
/*AND-FILTERS*/placeholder and the parameters filled in — next to the rows the database returned. That is usually enough to tell a wrong query from a wrong chart configuration. - Preview a change to a widget's SQL or chart configuration without saving it, correct it until the figures are right, and only then import it.
The assistant runs everything with the permissions of the user its connection signs in as, and seeing a widget's SQL needs the right to edit dashboard widgets.