
BI Reference — Calendar, Timeline, Report and Other Widgets
Most dashboards are built from charts, tables and metric cards, and those have their own guides. Seven older widget types fill the gaps between them: a Calendar and a Resource View for anything with a start and an end, a Timeline for a stream of events, a Report that runs a printed report inside the dashboard, an HTML block for free-form content built from a query, a Card Menu of shortcut buttons and Recent Visits, which shows the screens a user opens most. This page says when each one is the right choice and how to fill it in.
All seven are made on the DashBoard Widget screen (Administration → DashBoards → DashBoard Widget): pick the Type, give the widget an Arabic Chart Title and English Chart Title, and then fill the fields that type uses. They are placed on a dashboard like any other widget.
| Type | Use it for | Needs a query? |
|---|---|---|
| Calendar | Appointments, visits, deliveries, due dates on a month/week/day calendar | Yes |
| Resource View | The same, laid out one row per person, room or machine | Yes |
| Timeline | A short history of events, newest or oldest first | Yes |
| Report | An existing report, shown inside the dashboard | No |
| HTML | Free-form text or a list built from query rows | Optional |
| Card Menu | Big shortcut buttons to lists, new records, reports and dashboards | No |
| Recent Visits | The screens this user opens most often | No |
Timeline, Card Menu and Recent Visits need the new UI
Opened from the old interface, these three show a message that their type is supported in the new UI only, with a link that opens the same dashboard there. Calendar, Resource View, Report and HTML work in both.
The Parameters grid
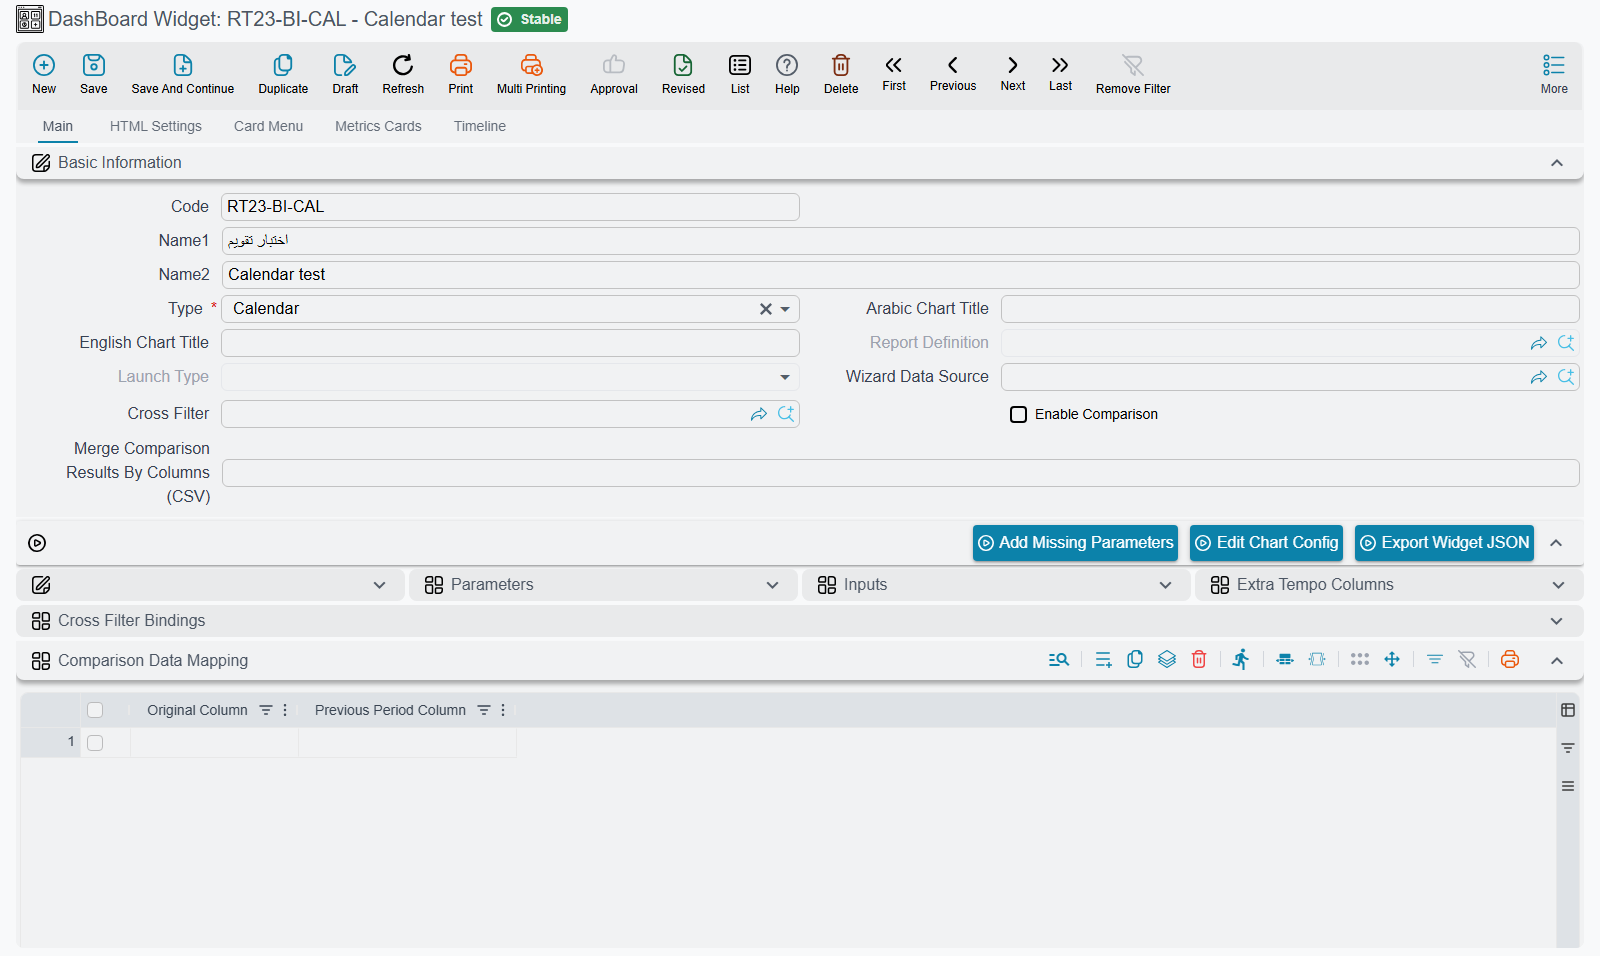
Calendar and Resource View, and the link settings of several other types, are configured in the Parameters grid on the main page of the widget. Each row pairs a fixed setting name with a value, which is normally the name of a column in your query.
You do not type the setting names. Choosing the Type fills the grid with every row that type understands, and the name column is read-only. If you changed the type, or the grid was emptied, press Add Missing Parameters to bring the rows back: it adds what is missing and keeps the values you already entered. In the value column, the screen suggests the column names of your query as you type. Rows you do not need are simply left empty.
Column names are matched exactly, so fromDT in the query and FromDT in the grid do not match.
Calendar
A Calendar shows each row of the query as an entry on a calendar with month, week and day views; it opens on the current month. Use it whenever the question is when: technician visits, delivery appointments, rental bookings, contract end dates, leave requests. Clicking an entry opens the record behind it.
The query returns one row per entry. For an appointment list that could be:
SELECT s.id, 'SalesInvoice' entityType,
       s.code + ' ' + ISNULL(c.name2, '') title,
       CAST(s.creationDate AS datetime) fromDT,
       CAST(DATEADD(minute, 30, s.creationDate) AS datetime) toDT
FROM SalesInvoice s
LEFT JOIN Customer c ON c.id = s.customer_id
WHERE 1 = 1 /*AND-FILTERS*/
Then fill these rows of the Parameters grid with the column names:
| Setting | What to put in it |
|---|---|
| Title | The column whose text is shown on the entry |
| FromDateTime | The column holding the start date and time |
| ToDateTime | The column holding the end date and time. Left empty, each entry gets the calendar's default length |
| LinkToType and LinkToID | The column holding the entity type (such as SalesInvoice) and the column holding the record's id. Fill both, and clicking an entry opens that record |
| URL | Instead of LinkToType/LinkToID: a column holding a web address to open when the entry is clicked |
| minTime and maxTime | Not column names but fixed times, such as 08:00:00 and 18:00:00. They limit the hours shown in the week and day views. Left empty, the whole day is shown |
The remaining rows (FromDate, ToDate, FromTime, ToTime) are an older way of giving the start and end in separate columns. Leave them empty and use the two date-time rows.
Cast dates to datetime
Return the start and end as datetime values, as the example does with CAST(... AS datetime). A column that holds only a date, such as a document's value date, needs the cast to become a date and time at midnight.
The query takes cross-filters through its /*AND-FILTERS*/ placeholder like any other widget, so a branch or date-range filter on the dashboard narrows the calendar too.
Resource View
A Resource View is the calendar turned sideways: one row per resource (a technician, a room, a vehicle, a machine) and time running across, with day, week and month buttons; it opens on the month. Use it when the question is who is busy when, for example to spot a free technician or a double-booked room.
It takes every Calendar setting above, plus three of its own:
| Setting | What to put in it |
|---|---|
| ResourceID | The column that identifies the resource, such as an employee code. Entries with the same value share a row. A row whose ResourceID is empty is not placed on any resource |
| ResourceName | The column with the name shown at the start of the resource's row |
| ParentResourceID | Optional: the ResourceID of a parent, to group resources under a heading row, such as technicians under their team. The heading shows the parent's name when the parent is itself a resource in the query, and its ResourceID otherwise |
SELECT s.id, 'SalesInvoice' entityType, s.code title,
       CAST(s.creationDate AS datetime) fromDT,
       CAST(DATEADD(hour, 2, s.creationDate) AS datetime) toDT,
       c.code customerCode, c.name2 customerName
FROM SalesInvoice s
JOIN Customer c ON c.id = s.customer_id
WHERE 1 = 1 /*AND-FILTERS*/
Here ResourceID is customerCode and ResourceName is customerName, so each customer gets its own row. Swap in your own tables: what matters is one row per booking, with the resource's code and name on it.
Timeline
A Timeline draws the query's rows as a chain of events, each with a heading, its date and time, a short line of text and an icon. Use it for a story told in order, such as the last ten invoices of the day, the steps of a project, or the latest changes on a customer's account. It shows the rows in the order the query returns them, so end the query with the ORDER BY you want.
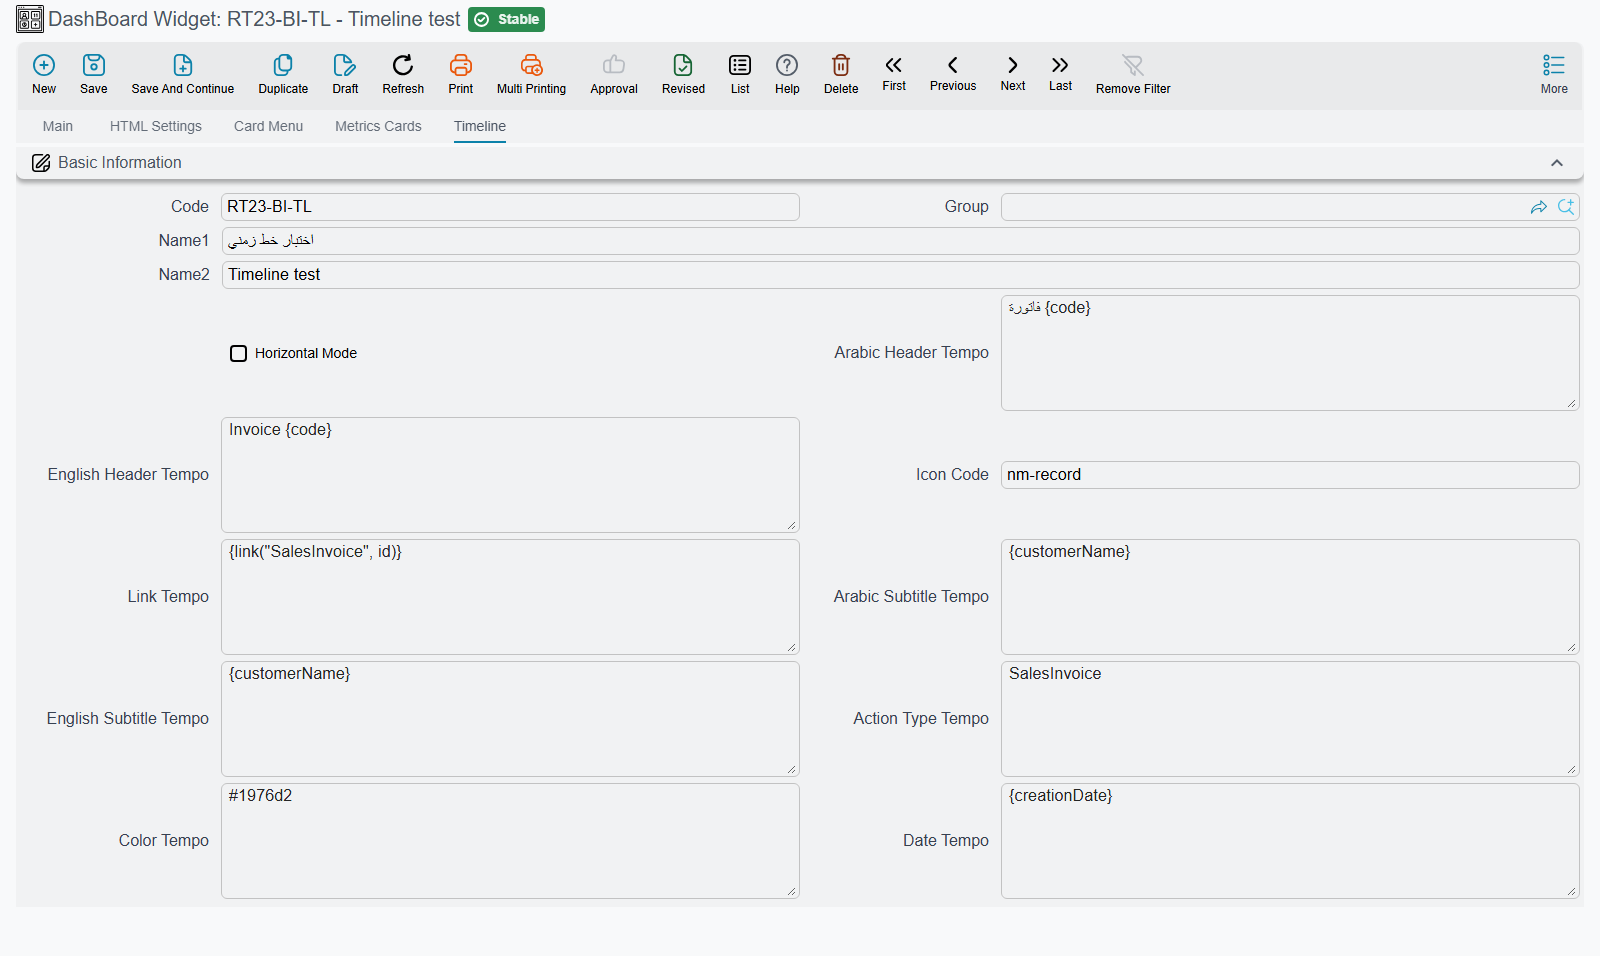
A Timeline does not use the Parameters grid. Its settings are on the widget's Timeline tab, and each one is a Tempo template: write a column name in braces, {code}, to use that column's value for each row.
| Field | What it does |
|---|---|
| Horizontal Mode | Ticked, the events run across the widget in a row; cleared, they run down it |
| Arabic Header Tempo / English Header Tempo | The heading of each event. When the event has a link, the heading is the link |
| Arabic Subtitle Tempo / English Subtitle Tempo | The line under the heading |
| Date Tempo | The event's date and time, normally just the column: {creationDate} |
| Action Type Tempo | A short label shown under the date. A known system name is translated, so SalesInvoice shows as Sales Invoice |
| Icon Code | The icon in the event's circle: a Material icon name such as receipt, or {iconColumn} to pick it per row |
| Color Tempo | The colour behind the icon, as #1976d2 or {colorColumn} |
| Link Tempo | Where the heading leads. {link("SalesInvoice", id)} opens the record whose id is in the id column |
A worked example, for the latest invoices:
SELECT TOP 10 s.id, s.code, c.name2 customerName,
       CAST(s.creationDate AS datetime) creationDate
FROM SalesInvoice s
LEFT JOIN Customer c ON c.id = s.customer_id
WHERE 1 = 1 /*AND-FILTERS*/
ORDER BY s.creationDate DESC
with English Header Tempo Invoice {code}, English Subtitle Tempo {customerName}, Date Tempo {creationDate}, Action Type Tempo SalesInvoice and Link Tempo{link("SalesInvoice", id)}.
The Date Tempo must give a date and a time
The value has to read as a date followed by a time. A date-only column stops the widget with a message that starts Error preparing chart: java.text.ParseException: Unparseable date. Cast it in the query, CAST(valueDate AS datetime), as the example does.
Report
A Report widget runs an existing report inside the dashboard, so a report that people open every morning can sit beside the charts instead of in a separate window. It needs no query:
| Field | What to put in it |
|---|---|
| Report Definition | The report to run |
| Launch Type | Direct runs the report as soon as the dashboard opens and shows the result. WithParamter shows the report's parameters form inside the widget; the user fills it and runs the report from there |
Both fields are enabled only while the Type is Report, and choosing another type clears them.
Choose Direct for a report whose parameters all have sensible defaults, such as today's cash position. Choose WithParamter when every user needs to pick something first, such as a customer or a period. Give the widget a generous height either way, since a report needs more room than a chart.
HTML
An HTML widget shows content you write yourself, built from the rows of its query. Use it when a chart is too much and a table too little: a sentence that reads "23 orders are waiting for dispatch, the oldest since Sunday", a short list of overdue tasks, or a block of instructions with live figures in it.
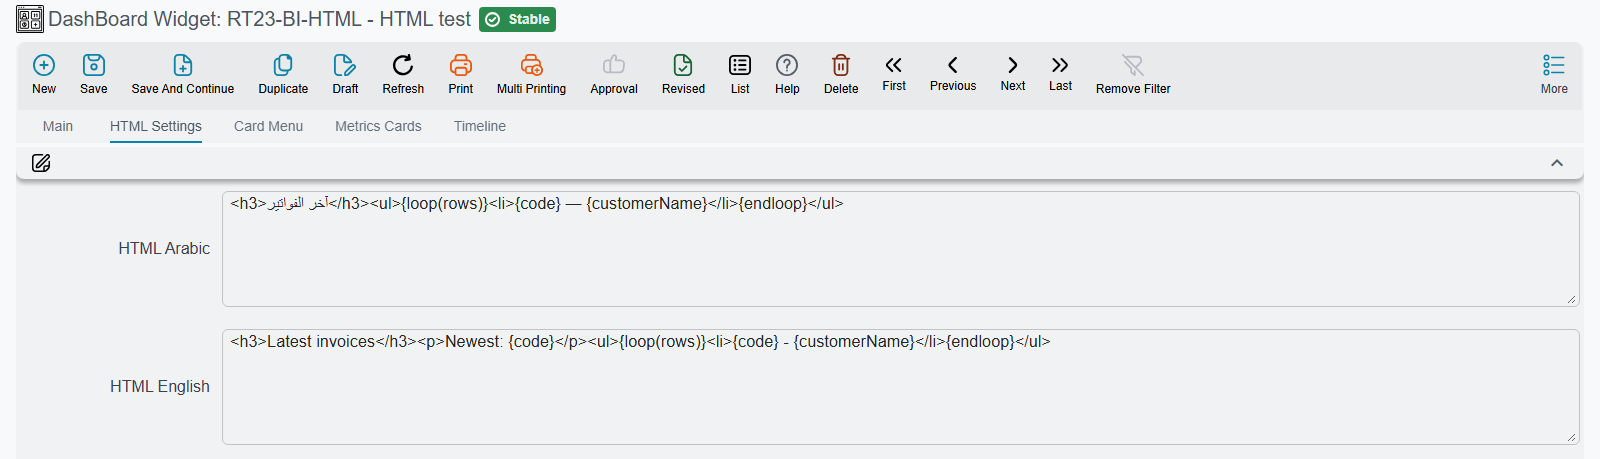
The content is written on the widget's HTML Settings tab, in HTML Arabic and HTML English (each user sees the one for their language). Both are Tempo templates run over the query result:
{columnName}gives that column's value from the first row;{loop(rows)} … {endloop}repeats its contents once per row.
For example, with the query
SELECT TOP 5 s.code, c.name2 customerName
FROM SalesInvoice s
LEFT JOIN Customer c ON c.id = s.customer_id
WHERE 1 = 1 /*AND-FILTERS*/
ORDER BY s.creationDate DESC
the template
<h3>Latest invoices</h3>
<p>Newest: {code}</p>
<ul>{loop(rows)}<li>{code} - {customerName}</li>{endloop}</ul>
shows a heading, the newest invoice number and a list of all five.
The Parameters grid has one row for this type, HTMLOpenInIFrame. Left at false, the HTML is placed straight into the dashboard and takes on the dashboard's own text style. Set to true, it is shown in a separate frame of its own, which suits a complete page with its own styles.
HTML or Text Block?
For a heading or a fixed paragraph with no figures in it, use a Text Block widget instead: it has a rich-text editor and needs no query. Use HTML when the content comes from the data. See TextBlock.
Card Menu
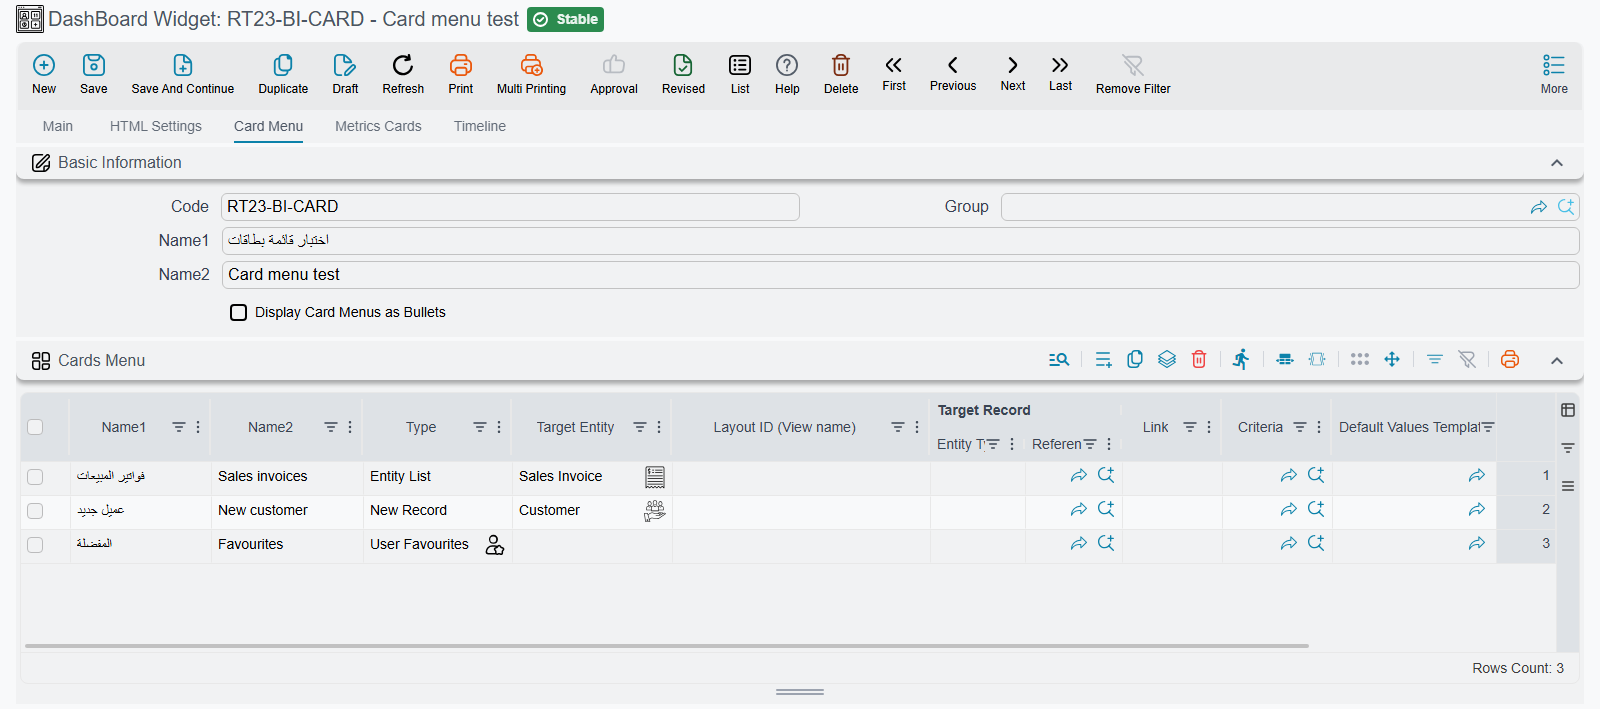
A Card Menu is a block of large shortcut buttons, one per line of its grid. Put one on a department's home dashboard so the screens that team uses every day are a single click away from the figures they watch: New Sales Order, Customers, Today's Deliveries, the Sales reports.
It needs no query. Its lines are on the widget's Card Menu tab, and each line works like a menu item:
| Column | What to put in it |
|---|---|
| Arabic and English name | The button's text in each language |
| Type and the target columns | What the button opens, exactly as for a menu item: a list, a new record (optionally with a Default Values Template), one record, a report, a dashboard, a link. See What an entry can open |
| Icon Code | A Material icon name. Left empty, an icon is chosen from the type |
| Color | The button's background colour. The text turns white or black to stay readable |
Four types turn one line into several buttons: User Favourites becomes a button per favourite of the signed-in user, All Reports a button per report group, Dashboards Group a button per dashboard in the group, and Auto Dash Boards a button per dashboard of every automatic group.
Tick Display Card Menus as Bullets to draw the buttons as a narrow vertical list instead of a grid of cards, which fits a side column of the dashboard.
A Card Menu sizes itself to its buttons, so the height you give it on the dashboard is not used.
Recent Visits
A Recent Visits widget shows the screens the user has opened most, grouped under the last day they used the system, the day before, and earlier days. Each card names the screen or record, shows roughly how often it was opened, and opens it again with one click. Once enough screens have been opened three times or more, the ones opened only once or twice are left out, so the list stays short. Opening a blank new record is not counted. It is a personal shortcut list that builds itself, which makes it a good companion to a Card Menu on a home dashboard.
There is nothing to configure: choose the type, place it on the dashboard, and it fills up as the user works. Its heading is always Recent Visits.
The list is kept by the browser, not on the server. It follows the browser rather than the user: someone who signs in on a new computer starts with an empty list, and people who share one browser see one shared list. Clearing the browser's site data empties it.
Like a Card Menu, it sizes itself to its content.