
Project Stages
Most of Project Management (ECPA) is built around people and hours. The Project Stage is the one screen in the module that steps back from hours and asks a different question: this run of phases — did it finish on time, and did it make money?
It answers both on one sheet. The top half is a schedule: you list the phases in order, give each one a target number of days, and the document chains the dates so that each phase starts where the previous one ended. Delays booked later push the expected dates out beyond the targeted ones, so the two columns sit side by side and the slippage is visible without arithmetic. The bottom half is a margin sheet: you attach the invoices that were billed on the work and the documents that cost it — stock issues, employee days, asset days, bought-in services, payments — and the document totals both sides into a profit figure.
Where to find it: Project Management → Projects → Project Stage. Like every screen in the module it needs licence code ecpa.
A Stage Is Not Attached to a Project
Before anything else, one fact about how this screen works, because everything else on the page reads differently once you know it.
A project stage has no project field. You will not find one on the Main page, on any tab, or on the list view — and the document never writes anything back to a project. The link to a project is indirect: each line of the schedule names a milestone, milestones belong to projects, and that is the whole of the relationship. Nothing you enter here appears on the Managed Project screen; the project's own Total Project Cost is unaffected; its status is unaffected; its completion percentage is unaffected.
Three practical consequences follow:
- You find a stage by its own document code, by the project type and sub type on its header, or by its dimensions — not by drilling down from a project.
- A stage may carry milestones from more than one project. The system does not check that they belong together. That is occasionally useful (a shared mobilisation period across two towers of the same development) and is otherwise something for your own naming discipline to prevent.
- Committing a stage does not "close" any milestone. The milestone status you set on a stage line lives on the stage line; the milestone master record is not touched.
Read the stage as a standalone commercial sheet about a named run of work. That is what it is, and on those terms it is the only place in the module where income and cost appear on the same screen — see Where Project Cost and Revenue Come From for the wider picture.
Milestone or stage?
Two different records, and the names are close enough to trip anyone up. A Project Milestone is a master file — one named phase of one project ("Concept Design" on Marina Tower). A Project Stage is this document, which lists several of those milestones and puts a schedule and a margin around them. Milestones are generated from the Milestones page of the project itself; see Milestones and the Phase–Discipline Matrix.
The Schedule
The Main page carries the usual document header — document code and book, term, issue date, value date — plus the project type and sub type the stage is filed under, its status, five attachment slots and a description. Then comes the Details grid, which is the schedule.
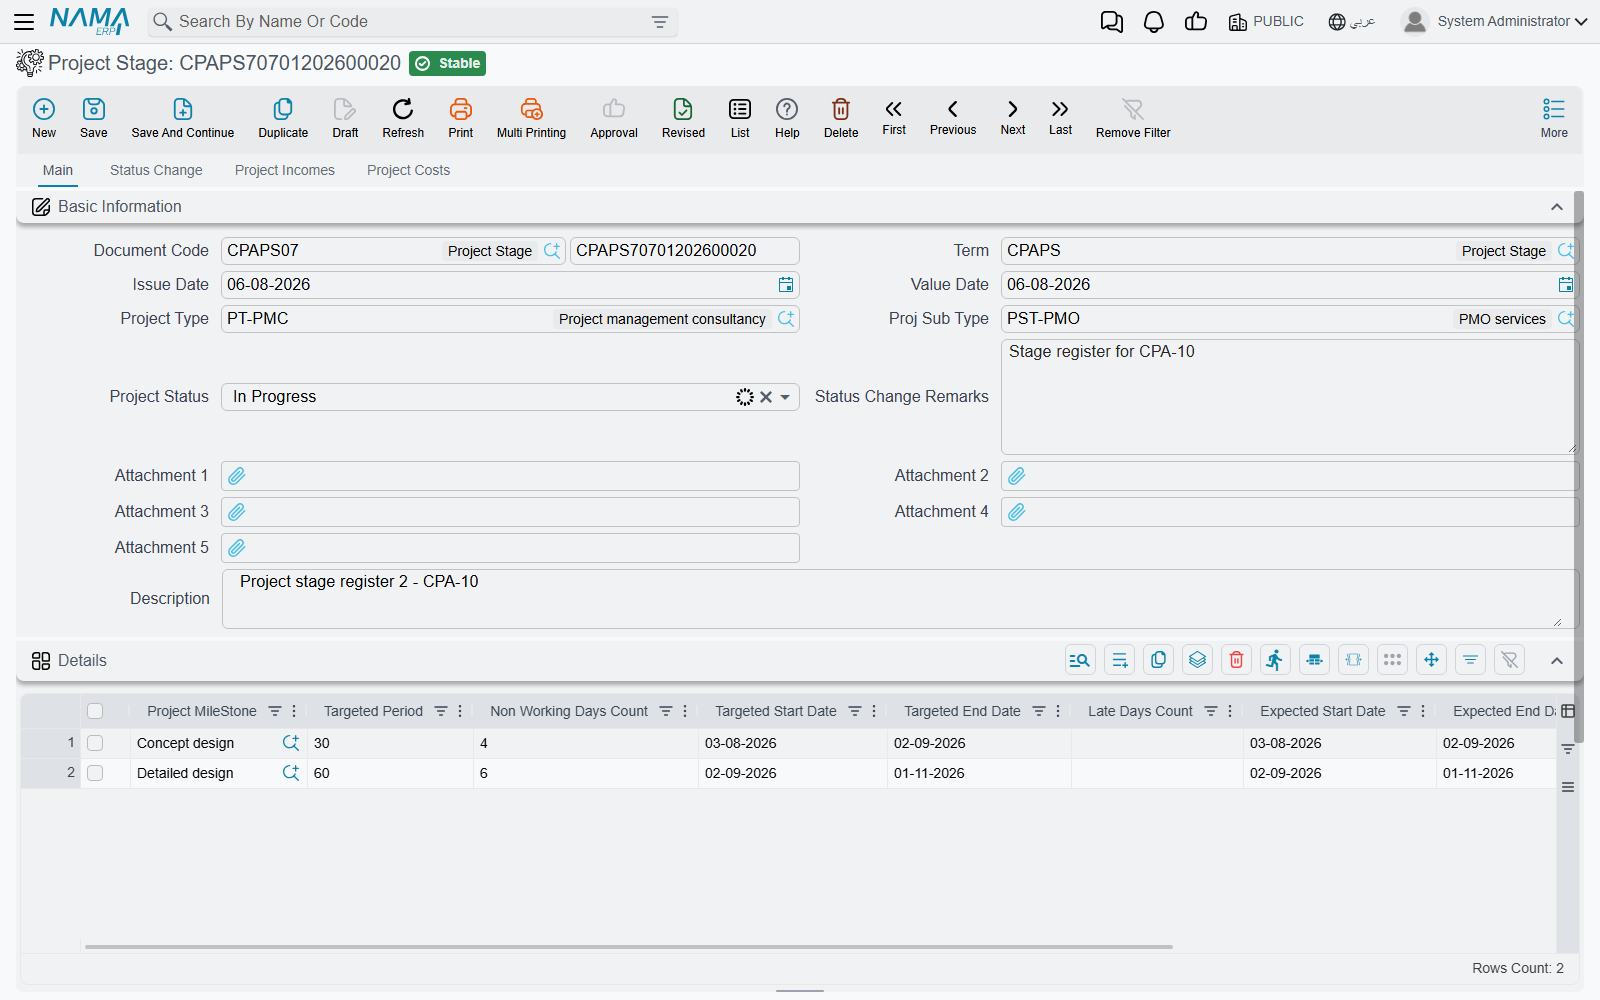
Take an engineering office running the design phases of Marina Tower. Three milestones, in order, starting 1 March:
| Project Milestone | Targeted Period | Non Working Days | Targeted Start | Targeted End |
|---|---|---|---|---|
| Concept Design | 30 | 4 | 01-03-2026 | 31-03-2026 |
| Schematic Design | 45 | 6 | 31-03-2026 | 15-05-2026 |
| Tender Documents | 25 | 2 | 15-05-2026 | 09-06-2026 |
Only four of those numbers were typed: the three targeted periods and the first line's targeted start date. Everything else in the table is worked out by the document.
- Targeted End Date is the line's targeted start plus its targeted period.
- Targeted Start Date on every line after the first is the previous line's targeted end — the phases are assumed to run back to back. Type the start date on the first line only.
- Non Working Days Count is a note about the phase, not a scheduling input. It does not lengthen or shorten the dates; it is used only in the "net after non-working days" totals below.
Because the chain runs top to bottom, the way to move a later phase is to change an earlier phase's targeted period, not to type a date on the later line. A milestone may appear only once on the document, and the picker helps you here — it hides any milestone already used on the lines.
Two further columns record where each phase stands: Project Milestone Status (Initial, In Progress, Finished) and a Status Change Remarks box beside it.
Late Days and the Expected Dates
Three more columns sit to the right of the targeted ones, and they are the reason the screen is worth keeping up to date:
- Late Days Count — days of slippage on this phase. You cannot type this. It is written only by Stage Extensions, the short document that grants more time, and it always holds the total across every committed extension for that phase.
- Expected Start Date and Expected End Date — the same chain again, but with the late days added. The first line's expected start is its targeted start; every later line's expected start is the previous line's expected end; and each expected end is the expected start plus the targeted period plus the late days.
Suppose the client took ten extra days to sign off the massing, and an extension of 10 days is committed against Concept Design. The targeted column does not move — it is the promise, and it stays as evidence of the promise. The expected column tells the truth:
| Project Milestone | Late Days | Expected Start | Expected End | Targeted End |
|---|---|---|---|---|
| Concept Design | 10 | 01-03-2026 | 10-04-2026 | 31-03-2026 |
| Schematic Design | 0 | 10-04-2026 | 25-05-2026 | 15-05-2026 |
| Tender Documents | 0 | 25-05-2026 | 19-06-2026 | 09-06-2026 |
One late phase at the top has pushed the whole programme out by ten days, which is exactly the behaviour a designer would expect and exactly the number the client will ask about.
The Consolidation Totals
Underneath the grid, a read-only group adds the columns up. For the example above:
| Consolidation field | Value | How it is reached |
|---|---|---|
| Total Targeted Period | 100 | 30 + 45 + 25 |
| Late Days Count | 10 | sum of the line late days |
| Total Expected Period | 110 | targeted + late |
| Non Working Days Count | 12 | 4 + 6 + 2 |
| Net After Non Working Targeted Period | 88 | 100 − 12 |
| Net After Non Working Expected Period | 98 | 110 − 12 |
The last two lines are why the non-working column exists: they turn a calendar duration into working days, which is the number a resource planner actually wants.
Below the totals sits the standard Dimensions group — legal entity, branch, department, sector and analysis set — exactly as on any other document.
The Status Change History
The second tab, Status Change, is filled entirely by the system. It holds two audit grids: one for the milestone statuses on the lines (which milestone, from which status, to which status, changed by whom, changed on) and one for the document's own status. A row is appended whenever a status or its remark changes, so the tab reads as a running commentary on how the phases moved rather than a single "current state" snapshot. The Changed On stamp is the day the edit was made, not the document's value date.
The document's own status offers three values — In Progress, Finished and Cancelled — and it describes this sheet. It is the stage's status, not the status of any project, and it is not propagated anywhere.
The Income Side
The third tab, Project Incomes, is the only place in Project Management where revenue is attached to anything other than an invoice's own ledger entry.
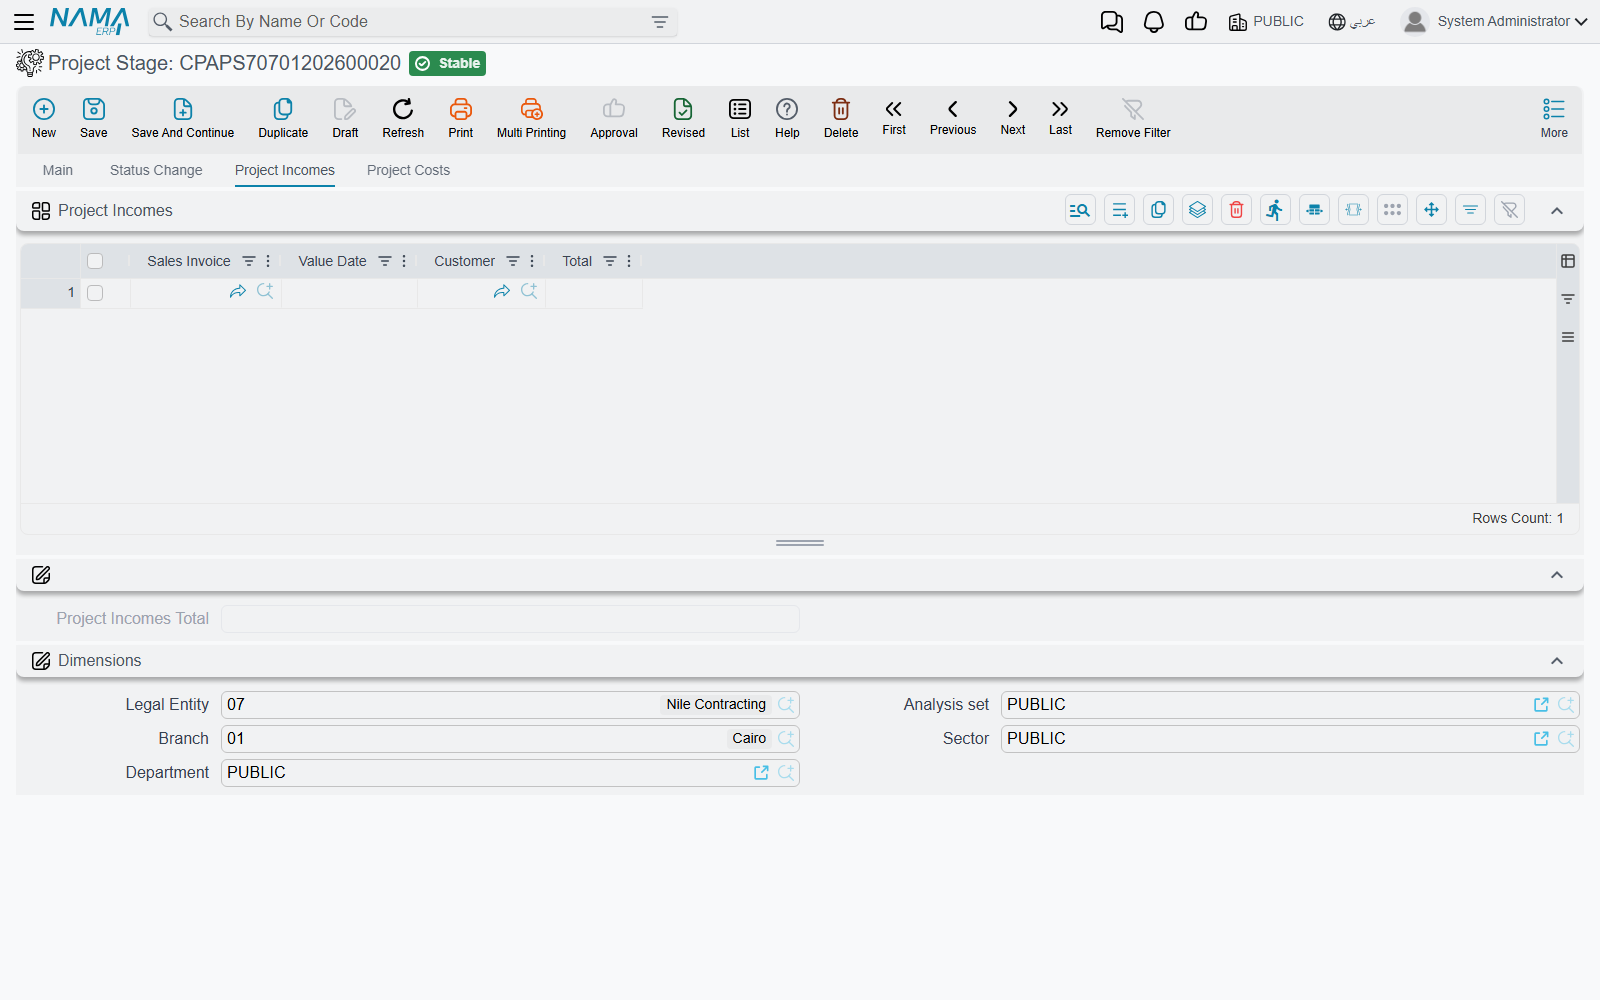
Each row picks one Sales Invoice; the document then fills in the invoice's value date, its customer and its net value for you, so the only real decision is which invoices belong to this run of phases. On Marina Tower, two:
| Sales Invoice | Value Date | Customer | Total |
|---|---|---|---|
| SI-2026-0431 | 12-04-2026 | Marina Development | 250,000 |
| SI-2026-0588 | 27-05-2026 | Marina Development | 168,000 |
Project Incomes Total: 418,000.
Note which document this column takes. It is the sales invoice from the supply-chain side of the system — the same document a trading company raises. The Project Invoice that this module raises against collected hours and expenses is a different document, and it is not what this grid collects. Sites that bill entirely through project invoices will find the income tab of limited use and should read the profit figure accordingly.
The Cost Side
The fourth tab, Project Costs, holds five grids, each followed by its own total. This is the module's only consolidated cost view — and the single most important thing to understand about it is that every line on it is put there by hand.
Nothing arrives here on its own. A stock issue made to the project does not appear; an approved timesheet does not appear; a committed project expense document does not appear; a purchase invoice does not appear. Somebody opens this tab and picks each document. The automation the screen does offer is real but modest: once you have picked a document, its date, its counterparty and its value are read off it for you, so the numbers are the document's numbers and not a retyped guess.
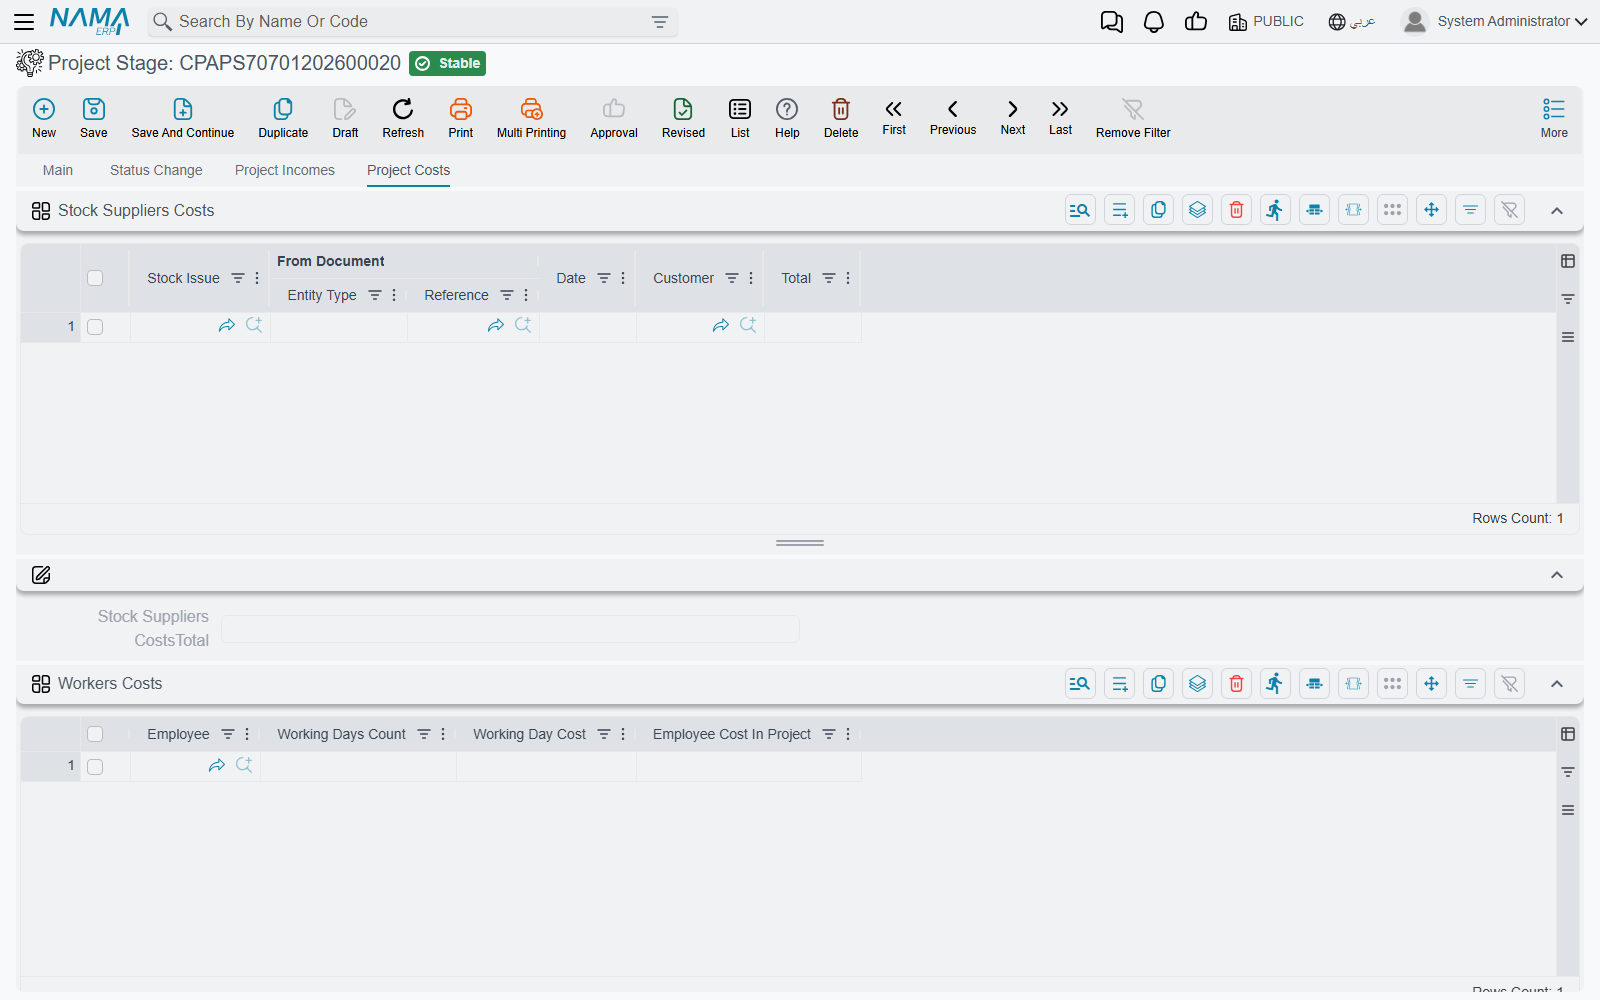
The screenshot is cut at the fold
The image above shows the first two grids only. The fixed-asset, transportation and other-cost grids and the Project Profit group sit below the visible area of the tab; scroll down on the real screen to reach them.
Stock Suppliers Costs — materials issued out of a warehouse for the work. Pick a Stock Issue and the row fills with its source document, date, customer and net value.
Workers Costs — the only labour figure on this sheet, and it is typed rather than collected. Three columns: employee, Working Days Count and Working Day Cost. The fourth, Employee Cost In Project, is their product. A site engineer at 40 days on 700 a day gives 28,000. This is deliberately a day rate and it is quite independent of the hourly costing that timesheets and tasks use elsewhere in the module — nothing is copied between them in either direction.
Fixed Asset Costs — the same shape for equipment: fixed asset, working days, working day cost, and their product. A survey rig at 30 days on 600 a day gives 18,000. There is no connection to depreciation, to asset custody or to any other fixed-asset document; the figure is your own estimate of what the equipment's time was worth to this work.
Transportation Costs — pick a Misc Purchase Invoice and the row fills with its source document, date, supplier and net value. The grid title names the usual case, but the column simply accepts a misc purchase invoice, so any bought-in service that was invoiced that way belongs here.
Other Costs — pick a Payment Voucher and the row fills with its source document, date, the supplier it was paid to and the amount. This is the catch-all for money that left the business against the work without passing through a purchase invoice.
Continuing Marina Tower:
| Cost grid | Total |
|---|---|
| Stock Suppliers Costs Total | 96,000 |
| Workers Costs Total | 74,500 |
| Fixed Asset Costs Total | 18,000 |
| Transportation Costs Total | 12,500 |
| Other Costs Total | 9,200 |
The Profit Roll-Up
At the foot of the cost tab, the Project Profit group repeats the six totals and gives the answer. The arithmetic is exactly as plain as it looks:
Project Incomes Total            418,000
  Stock Suppliers Costs Total     96,000
  Workers Costs Total             74,500
  Fixed Asset Costs Total         18,000
  Transportation Costs Total      12,500
  Other Costs Total                9,200
                                --------
  all costs                      210,200
                                --------
Project Profit                   207,800
The group lists the six component totals beside the profit figure; if you want the total cost as a number of its own, add the five cost lines. The totals are recalculated every time the document is saved and again when it is committed, so a stage that is being kept up to date always shows a current margin.
Two things this figure is not:
- It is not compared with anything. There is no budget in Project Management. The estimated-cost columns on a project and the contract value on its header are informational, and nothing on this screen — no validation, no warning, no block — checks the profit or the costs against them. A stage showing a loss commits exactly as readily as one showing a profit.
- It is not the project's cost. The Total Project Cost on the Managed Project screen is labour cost from approved timesheets and nothing else. The two numbers answer different questions and are not meant to agree. See Where Project Cost and Revenue Come From.
Committing, and the Guard Against Double Counting
A project stage is a document: it carries a book, a code, a term, an issue date and a value date, and it is committed rather than simply saved. Committing runs three checks.
- The first line must have a targeted start date — without it there is nothing for the chain to start from.
- A milestone may not appear twice on the same document.
- No income or cost document may be counted twice. The same sales invoice, stock issue, misc purchase invoice or payment voucher may not appear twice on this stage, and may not already appear on another committed project stage. If it does, the commit is refused.
That third check is the quiet hero of the screen. Because stages are assembled by hand and one project's work is often spread over several of them, the obvious risk is billing or costing the same invoice on two sheets — and the system will not let you. Note that it covers the four grids that hold a document reference. The workers and fixed-asset grids hold no document, so nothing stops the same employee or the same asset being entered on two lines; keep those two grids tidy yourself.
Committing has no financial consequences of its own: a project stage produces no ledger entry and no stock movement. Its effects are entirely internal — the status history is appended and the totals are recalculated. Cancelling one is correspondingly cheap: there is nothing to unwind, and the status history stays as a record of what happened.
Extending a Stage
You never type a delay onto the schedule. When a phase slips, raise a Stage Extension against the stage, naming the phase, the number of days and a reason. Committing it writes the days onto the matching line here and re-chains the expected dates, which is how the ten days on Concept Design in the table above got there.